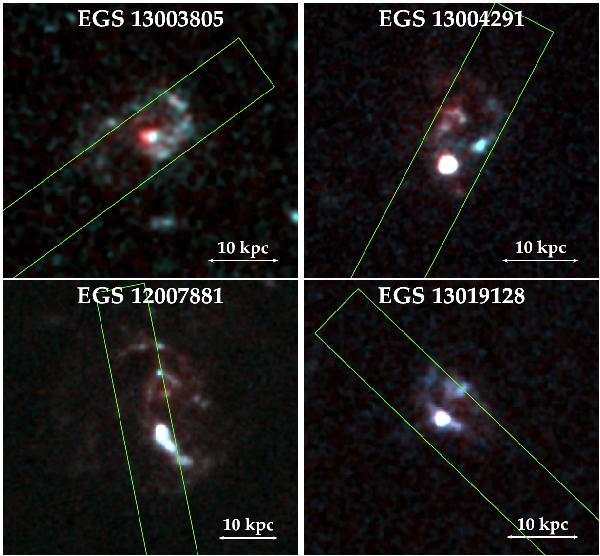
Fig. 1

Composite HST images of the four galaxies studied here, combining ACS I and V bands. The green box shows the DEEP2 slit used for each galaxy, whose size is indicated in Table 1. We assumed that the DEEP2 survey measured the position of the center of the galaxy more accurately than the HST, and shifted the HST image accordingly. North is up, east is left.
Current usage metrics show cumulative count of Article Views (full-text article views including HTML views, PDF and ePub downloads, according to the available data) and Abstracts Views on Vision4Press platform.
Data correspond to usage on the plateform after 2015. The current usage metrics is available 48-96 hours after online publication and is updated daily on week days.
Initial download of the metrics may take a while.


