| Issue |
A&A
Volume 553, May 2013
|
|
|---|---|---|
| Article Number | A71 | |
| Number of page(s) | 9 | |
| Section | Planets and planetary systems | |
| DOI | https://doi.org/10.1051/0004-6361/201220893 | |
| Published online | 06 May 2013 | |
Influence of the circumbinary disk gravity on planetesimal accumulation in the Kepler–16 system
1 Dipartimento di Fisica, University of Padova, via Marzolo 8, 35131 Padova, Italy
e-mail: This email address is being protected from spambots. You need JavaScript enabled to view it.
2 Observatoire de Paris, Section de Meudon, 92195 Meudon Principal Cedex, France
3 Observatoire de la Côte d’Azur, BP 4229, 06304 Nice Cedex, France
4 DAMTP, University of Cambridge, Wilberforce Road, Cambridge CB30 WA, UK
Received: 12 December 2012
Accepted: 18 March 2013
Abstract
Context. Recent observations from NASA’s Kepler mission detected the first planets in circumbinary orbits. The question we try to answer is where these planets formed in the circumbinary disk and how far inside they migrated to reach their present location.
Aims. We investigate the first and most delicate phase of planet formation when planetesimals accumulate to form planetary embryos.
Methods. We use the hydrodynamical code FARGO to study the evolution of the disk and of a test population of planetesimals embedded in it. With this hybrid hydrodynamical-N-body code we can properly account for the gas drag force on the planetesimals and for the gravitational force of the disk on them.
Results. The numerical simulations show that the gravity of the eccentric disk on the planetesimal swarm excites their eccentricities to much higher values than those induced by the binary perturbations only within 10 AU from the stars. Moreover, the disk gravity prevents a full alignment of the planetesimal pericenters. Both these effects lead to high impact velocities, beyond the critical value for erosion.
Conclusions. Planetesimal accumulation in circumbinary disks appears to be prevented close to the stellar pair by the gravitational perturbations of the circumbinary disk. The observed planets possibly formed in the outer regions of the disk and then migrated inside by tidal interaction with the disk.
Key words: planet-disk interactions / planets and satellites: formation
© ESO, 2013
1. Introduction
Most Sun-like stars are believed to form as gravitationally bound pairs. Estimating the prevalence of planets in binary systems is then relevant when computing the fraction of stars with planets. Planets in circumstellar orbits (S-type orbits) around one of the components of a binary system have been found in both close (~20 AU) and wide binary systems confirming that the binary perturbations may not be able to prevent planet formation even if they can significantly affect the course of it. This last issue has been explored in detail using numerical simulations, most of them modeling the intermediate stage of planet formation, the accumulation of kilometer-sized planetesimal (Marzari & Scholl 2000; Thébault et al. 2004, 2006, 2008; Kley & Nelson 2008; Thébault et al. 2009; Marzari et al. 2009a,b; Xie & Zhou 2009; Xie et al. 2010b; Paardekooper et al. 2008; Marzari et al. 2012).
These studies have shown that this phase might be the most sensitive to binarity effects, because mutual impact velocities can be increased to values that may threaten the formation of large bodies. Crucial in this phase is the evolution of both the eccentricity and perihelion longitude of the planetesimals under the coupled action of the companion gravity and gas drag force. A size-dependent phasing of the orbits develops on the timescale of the secular perturbations of the binary, leading to high (and accretion inhibiting) collision velocities among any planetesimal population with even a small size spread (Thébault et al. 2006). Mechanisms that could come to the rescue of the planetesimal accumulation process are (i) a small inclination between the circumstellar disk and the binary plane (Xie et al. 2010b); (ii) an outward migration of protoplanetary embryos formed in safer regions closer to the star (Payne et al. 2009); (iii) planetesimal growth through the sweeping of small collisional fragments (Paardekooper & Leinhardt 2010; Xie et al. 2010a); or (iv) that the binary was initially wider and was compacted by stellar encounters during the early evolution of the stellar cluster it was born in (Thébault et al. 2009). Another, more radical solution would be that planet formation proceeds through a different channel in close binaries, a hypothesis that could be supported by the exoplanets found in close binaries having different properties than those around single stars (Duchêne 2010). For a more detailed discussion of circumprimary planet formation in binaries, see the recent review by Thebault (2011).
Recently, the Kepler team announced the discovery of another category of exoplanets in binaries, i.e, transiting circumbinary planets, which are planets moving on P-type orbits circumventing both the stars. The first of such planets to be discovered was Kepler–16 b (Doyle et al. 2011) followed by Kepler-34 b, Kepler-35 b (Welsh et al. 2012), and Kepler-47 b,c, the first circumbinary multiplanet system (Orosz et al. 2012). The formation of planets in circumbinary P-type orbits is very different than in S-type orbits (around a component of the pair) since the secular perturbations of the companion star on a planetesimal swarm have different intensities and forms compared to what is produced by an external perturber. As a consequence, the outcomes of numerical modeling of planetesimal evolution in S-type orbits cannot be applied to studying planet formation in circumbinary orbits.
At present, two numerical studies have been performed to estimate where in the initial circumbinary disk around Kepler–16 planetesimal accumulation can proceed, even if perturbed and possibly at a slower pace, toward the accumulation of large planetary embryos. Both studies (Meschiari 2012; Paardekooper et al. 2012) used an N-body approach to compute the trajectories of a large number of planetesimals perturbed by the nonspherically symmetric gravitational field of the stellar pair. The first paper (Meschiari 2012) focused on the long-term effects of the secular perturbations finding potential accretion-friendly zones within 1.75 AU from the star pair and beyond 4 AU. In these regions the mutual impact velocity between planetesimals were, in the majority of collisions, lower than the threshold velocity causing disruption. Their eccentricity distribution is centered around the forced component of the secular perturbations of the binary given by  (1)where μ = m2/(m1 + m2) is the binary mass ratio, aB and eB the semimajor axis and eccentricity of the binary system and a is the semimajor axis of the planetesimal (Moriwaki & Nakagawa 2004).
In a subsequent paper, Paardekooper et al. (2012) re-analyzed planetesimal accumulation around Kepler–16 and also explored two other systems, Kepler–34 and Kepler–35. They focused on the effects of short term eccentricity perturbations on the planetesimal motion. They also considered the possible reaccumulation of small fragments, produced by the shattering of planetesimals impacting at high relative velocity, onto the largest intact planetesimals. Even if this second-generation accretion helps, Paardekooper et al. (2012) conclude that planet formation is not possible at the present location of the planet, but may however be effective beyond twice the present semimajor axis (a = 0.7 AU). Both the previously mentioned studies (Meschiari 2012; Paardekooper et al. 2012) claim that, in spite of the combined perturbations of the binary star system and of the friction from the gas of the circumbinary disk, planet formation seems to be possible beyond a distance of about 2−4 AU from the barycenter of the pair, which is further out than the present location of the exoplanets but still relatively close to the binary.
The basic assumption of an N-body approach to the problem of planetesimal accumulation requires that the gas disk in which the planetesimals are embedded is axisymmetric. This approximation may not be a good one when dealing with circumbinary disks since the gravitational perturbations of the star pair may strongly affect the disk shape. As already shown in (Kley et al. 2008; Marzari et al. 2009a, 2012; Müller & Kley 2012), the disk may become eccentric and be perturbed by strong spiral waves. In that paper, the parameters of the system were similar to those of Kepler–16 but the disk was truncated at 3 AU and the isothermal approximation was used. In this paper we adopt a more complete approach modeling the circumbinary disk that gave origin to the planet in Kepler–16 as a radiative disk extending out to 10 AU from the barycenter of the two stars. The radiative model is better suited to describe the earlier stages of the disk evolution when it is massive and probably optically thick. It has also been shown (Marzari et al. 2012; Müller & Kley 2012) that radiative disks, when perturbed, develop overall shapes and internal structure that differ from those of locally isothermal disks, in particular concerning the disk eccentricity and the propagation of spiral waves which may significantly perturb planetesimal trajectories. For this reason, in order to obtain an accurate modeling of the disk structure, in our simulations we solve an energy equation that includes the viscous heating of the disk and radiative losses. On the basis on the above mentioned references we expect that a detailed treatment of the disk thermodynamics is more relevant for the evolution of the disk eccentricity than the inclusion of the effects of self-gravity. In addition, considering a larger disk allows a better handling of the gravitational perturbations of the disk on the planetesimal orbits. If the disk is more massive, since we model a larger portion of it, the perturbations due to a potentially uneven mass distribution, due to the building up of an eccentric shape, are considerably stronger.
In this paper we compute the trajectories of a large number of planetesimals perturbed by the primordial circumbinary disk. Our simulations focus on the Kepler–16 system and show that the gravitational perturbations of the disk excite high eccentricity values in the planetesimal swarm with a mechanism similar to that described by Nelson & Gressel (2010). These high eccentricities, up to 0.4 and beyond, are able to prevent the onset of accumulation within 10AU from the stars and maybe also farther out. The present planet observed in the system possibly formed in the outer regions of the disk and migrated inside as described in Pierens & Nelson (2007, 2008). The migration possibly occurred in all the circumbinary systems mentioned above and is strongly suggested by the coincidence between the semimajor axis of the planets and the location of the internal stability limit which can be derived from Holman & Wiegert (1999). As a consequence, our results do not suggest that planet formation is not possible, but that it had to occur in the outer regions of the disk where the perturbations of the star pair are less effective in producing nonaxisymmetric density perturbations on the disk.
In Sect. 2 we describe the numerical model and in Sect. 3 we describe out results. Section 4 is devoted to the discussion of the results.
2. The hybrid algorithm modeling the evolution of the disk and planetesimals
To compute the trajectories of planetesimals and, at the same time, the evolution of the gaseous disk under the perturbations of the binary, we have used the two-dimensional numerical code FARGO (Masset 2000) modified to fit the problem. The hydrodynamical equations are solved in a cylindrical coordinate system centered on the barycenter of the binary. We focus on the Kepler–16 system where the mass of the primary is M1 = 0.69 M⊙, that of the secondary M2 = 0.20 M⊙, the binary semimajor axis aB = 0.224 AU and the eccentricity eB = 0.159. The two stars are evolved on a fixed Keplerian orbit neglecting any change in the binary system due to gas accretion by the stars and any momentum exchange with the disk. This choice is justified by the models of Pierens & Nelson (2007) suggesting that a system made of the binary and the disk reach a near-stationary state after some evolution. Incidentally, these authors used binary parameters actually close to those derived for Kepler–16.
The grid used in our calculations to model the disk has Nr = 256 radial zones and Ns = 512 azimuthal zones, and an arithmetic spacing is used along the radial direction i.e. the radial distance is divided in equal size intervals. All the simulations are carried out including an energy equation of the form (Baruteau & Masset 2008; Marzari et al. 2012) 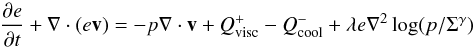 (2)where e = p/(γ − 1) is the thermal energy density, γ = 1.4 is the adiabatic index, and v denotes the gas velocity. In the equation we do not include the effects of stellar irradiation. The term
  is the heating term due to the viscous heating while the cooling term
  is assumed to be
  , where σSB is the Stefan-Boltzmann constant and Teff is the effective temperature estimated as (Hubeny 1990)
  (3)for an effective optical depth
  (4)The vertical optical depth, τ, is approximated as τ = κΣ/2, where for the Rosseland mean opacity, κ, we adopt the formulae in Bell & Lin (1994). Following Paardekooper et al. (2011), we also model thermal diffusion as the diffusion of the gas entropy, s, defined as s = ℛ(γ − 1)-1log (p/Σγ). This corresponds to the last term on the right-hand side of Eq. (2), where λ is a constant thermal diffusion coefficient. Throughout this study, we adopt λ = 10-6 in code units. The initial aspect ratio h = H/r is constant all over the disk and is set to 0.05. A constant shear kinematic viscosity of 10-5 (normalized units), which corresponds at about 5 AU within the disk to an α value of about 2.5 × 10⁻³ (Shakura & Sunyaev 1973), is used and open boundary conditions are adopted with standard outflow at both the inner and outer edge. The initial temperature profile of the disk is computed as T(r) = T0r-1 where the value at 1 AU is set to T0 = 630 K. This value is derived following the approach described in Marzari et al. (2012) and it depends on the initial choice of the aspect ratio h. The Toomre-Q parameter is quite high in the inner disk parts, where the binary’s perturbation is the strongest. Its radial dependence is approximately Q(R) ~ 100 × (R/1 AU)− 3/2 and a value of about 10 is measured at R = 5 AU.
We neglect in our model the apsidal precession of the binary due to its interaction with the disk. According to Rafikov (2013), the period of the binary precession due to an axisymmetric disk is given by  (5)where Md is the disk mass, MB the sum of the star masses, nB the mean motion of the binary, rin the inner border of the disk and ro the outer one, and
  is a constant whose value depends on the ratio of aB and rin and on the mass ratio and it can be approximated by 0.5. Using this equation we find that
  yrs (after some initial evolution, the mass of the disk settles to Md = 2.75 × 10⁻² M⊙). This is longer than the timescale over which the planetesimal eccentricity grows i.e. 103 yrs. We expect that the binary precession might have an effect on the long term evolution of the system but not on the short timespan we are covering with the model. In addition, since the disk in our simulations is eccentric, Eq. (5) may not be very precise being derived under the assumption of an axisymmetric disk. As a consequence, a full numerical approach is needed since the formula for the potential of a axisymmetric disk, used in Rafikov (2013), cannot be applied. We plan to explore this effect in the future hoping in an increase in computing power.
The forces acting on the planetesimals include the binary gravitational force, the gravitational force exerted by the disk and the gas drag force. The latter is calculated in the Stokes regime as (Adachi et al. 1976)  (6)where v is the relative velocity between the planetesimal and the gas and the parameter k (Kary et al. 1993) is given by
  (7)where CD is the aerodynamic drag coefficient for objects with large Reynold’s number, ρp and Rp are planetesimal density and radius, respectively, and ρg is the gas density in the midplane derived from the surface mass density Σ(r) through the relation
 ![Mathematical equation: \begin{equation} \rho _{\rm g}=\Sigma ( r) / [ ( 2\pi ) ^{1/ 2}H] \end{equation}](/articles/aa/full_html/2013/05/aa20893-12/aa20893-12-eq63.png) (8)with H the disk scale height (Günther & Kley 2002). Respect to Marzari et al. (2008) we adopt a more extended disk ranging from 0.5 to 10 AU from the binary system with a superficial density profile Σ = Σ0r− 1/2 where Σ0 is the density at 1 AU set to Σ0 = 2.5 × 10⁻⁴ in normalized units, i.e. ~2.2 × 10³ g/cm2, compatible with Minimum Mass Solar Nebula density.
(8)with H the disk scale height (Günther & Kley 2002). Respect to Marzari et al. (2008) we adopt a more extended disk ranging from 0.5 to 10 AU from the binary system with a superficial density profile Σ = Σ0r− 1/2 where Σ0 is the density at 1 AU set to Σ0 = 2.5 × 10⁻⁴ in normalized units, i.e. ~2.2 × 10³ g/cm2, compatible with Minimum Mass Solar Nebula density.
To refine the computation of the drag force acting on the planetesimals we extrapolate the density and velocity (ρ,v) of the gas at the planetesimal location with a bilinear fit from the values at the borders of each grid cell. This is a refinement of the algorithm used in Marzari et al. (2008).
3. The results
In this section we compute the orbital evolution of the planetesimals and of the disk. Before including the planetesimals in the model, we evolve the disk for 105 binary revolutions (approximately 104 yr). We then restart the simulation including 400 planetesimals on initially circular orbits with semimajor axis equally spaced from 1 to 8.8 AU and we compute their orbits and the disk evolution for 104 yrs.
3.1. The disk shape
In the upper panel of Fig. 2 we show isocurves of the surface density distribution of the disk confirming its eccentric shape responsible for strong gravitational perturbations on the planetesimal orbits. In the bottom panel we show the azimuthally-averaged disk eccentricity as a function of the distance from the stars, computed as in Marzari et al. (2012), for 3 different evolutionary times separated by 200 yr. The 3 curves suggest a strong variability of the internal disk shape with time. This is due to the propagation of density waves within the disk and was observed also in Marzari et al. (2012) for circumstellar disks in binaries. The behavior shown in Fig. 2, lower panel, differs from that illustrated in Pelupessy & Portegies Zwart (2013) but the two disk models are substantially different. Pelupessy & Portegies Zwart (2013) adopt a locally isothermal equation of state with a fixed temperature profile T(r) ~ 300 × R− 3/4 while our initial temperature profile is T(r) ~ 630 × R-1 and then it evolves in time due to radiative cooling and various sources of heating, including that arising from shock waves. In Fig. 1 we compare the temperature profile of the isothermal disk model by Pelupessy & Portegies Zwart (2013) with the averaged (over 200 yr) equilibrium profile of our radiative model. The difference in both absolute values and slope are noteworthy and this justifies the significant differences in terms of disk eccentricity.
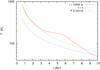 |
Fig. 1 Azimuthally and time averaged (200 yr) temperature profile of our radiative model at t = 10 000 yr (continuous red line) compared with the initial t = 0 yr nonequilibrium one (dashed green line) and the isothermal temperature profile adopted by Pelupessy & Portegies Zwart (2013) (dotted blue line). |
It has been shown in Marzari et al. (2012) that the temperature profile and the adopted energy equation have strong effects on the disk eccentricity in perturbed disks. A different thermodynamical model may lead to significant differences in the disk evolution and in particular in the eccentricity which may change by more than a factor 10. The temperature profile of our radiative disk is significantly higher compared to that of Pelupessy & Portegies Zwart (2013) and this plays in favor of a higher disk eccentricity in our model. On the other hand, Marzari et al. (2012) have shown that wave propagation through adiabatic compressions and expansions may be more efficiently damped in presence of radiative losses. This might cause a reduction of the disk eccentricity. All these physical phenomena that can lead to a different disk shape are more important that the disk self-gravity which would have less influence on the disk eccentricity than the thermodynamical model. In addition, self-gravity would not significantly affect the planetesimal dynamics in the inner regions due to the high value of the Toomre parameter Q. The initial different temperature profile is not the only difference between our model and that of Pelupessy & Portegies Zwart (2013), also the superficial density is difference as theirs declines as r-1 while ours follows a r− 1/2 law.
In a real disk, not only viscous heating and radiative cooling determine the disks thermal structure, but also stellar irradiation. Recently, Bitsch et al. (2013) have shown that stellar irradiation dominates in the outer regions of a disk while viscous heating rules close to the star where the structure of disks with and without stellar irradiation are similar. They find via numerical modeling that only beyond approximately 8 AU from the star stellar irradiation begins to have some influence on the evolution of a disk. However, a significant flaring of the disk is observed only for massive disks with Σ0 ~ 3000 g/cm3 and low viscosity (α ~ 0.001). In this case the flaring appears consistent beyond 30 AU from the star. In our model, the circumbinary disk of 16 Kepler extends out to 10 AU so it is expected not to be strongly influenced by stellar irradiation but to be dominated by the viscous evolution. In addition, in circumbinary disks density waves excited by the tidal gravity field of the binary propagate within the disk. In three dimensions these waves act like fundamental modes which correspond to large surface distortions in the disk (Lubow & Ogilvie 1998). Boley et al. (2005) have also shown that shock waves in 3D disks cause sudden increases in the disk scale height, a phenomenon called hydraulic jump. If the spiral waves excited by the binary perturbations are also shock waves, the hydraulic jumps in the vertical direction can shield the outer disk from stellar irradiation. Disk self-shadowing due to spiral density waves may strongly reduce the relevance of stellar irradiation in circumbinary disks.
The relatively fast changes of the disk eccentricity and of the disk gravity field has an additional perturbative effect on the planetesimals trajectories favoring eccentricity excitation. The orientation of the disk changes slowly with time on a timescale longer than 104 yrs. However, the computation of the planetesimal orbits is very time consuming and the timespan of each model is limited by the amount of CPU requirement. This is also the reason why we neglect the self-gravity of the disk in our simulations. A model without planetesimals has however shown that self-gravity does not significantly affect the shape and time variability of the circumbinary disk adopted in our simulations.
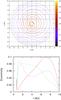 |
Fig. 2 Upper panel: isocurves of the disk density distribution (in normalized units) after 2 × 10⁵ binary revolutions illustrating the eccentric shape of the disk. Bottom panel: azimuthally-averaged disk eccentricity is drawn as a function of the radial distance at 3 different evolutionary times separated by 200 yr. |
3.2. Orbital evolution of 5 km size planetesimals
The three major sources of perturbations on the planetesimal orbits are:
-
the secular and short term perturbations of the gravity field of the binary;
-
the gas drag force;
-
the disk gravitational force.
The third perturbative component on the motion of planetesimals, which we will show to be the dominant one, is due to the gravity field of the disk. An asymmetric distribution of mass causes a significant perturbation of planetesimal trajectories. A similar phenomenon was also observed by Nelson & Gressel (2010) in fully turbulent disks where embedded planetesimals develop high mutual encounter velocities due to stochastic gravitational forces caused by turbulent density fluctuations. In our scenario the density has a shaped asymmetric pattern and this is a worse source of perturbation since its effect does not average to 0. In addition, the orientation of the perihelia play an important role in our scenario (Thébault et al. 2006; Marzari & Scholl 2000), in particular when high eccentricities are excited. The gravitational perturbations of the eccentric disk significantly decrease the level of perihelia alignment of same size planetesimals and this has important consequences on the accretion process.
 |
Fig. 3 Upper panel: distribution of the eccentricity vs. semimajor axis of 5 km size (radius) planetesimals at two different times. Bottom panel: distribution is that of the perihelion longitude vs. semimajor axis. |
In Fig. 3 we illustrate the distribution of the eccentricity and perihelion longitude vs. semimajor axis for 5 km size (radius) planetesimals. A peak in eccentricity with a value of about 0.4 is observed in between 2−3 AU with planetesimals quickly drifting inwards. The semimajor axis drift rate is in fact strongly dependent on the eccentricity of the body in the equation given by Adachi et al. (1976) describing the effect of the gas drag: 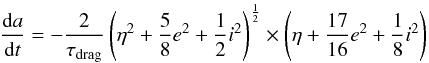 (9)where
 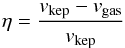 (10)measures of the amount by which gas orbits the star (or star pair) more slowly than a solid body due to the gas’s partial pressure support with vkep being the local Keplerian velocity. The timescale τdrag is given by:
  (11)The region developing high eccentricities is then depleted on a short timescale. The irregular shape of the disk in the inside region is at the origin of the high eccentricity values that lead to the fast inward drift. Farther out, the eccentricity is lower but still high compared to the pure N-body predictions. In this region the radial drift is reduced. The pericenter longitude is only partly aligned and the phasing depends on time since it changes with time. Only the region between 3 and 5 AU seems to maintain some level of coherence over time. This coherence leads to lower impact velocities.
 |
Fig. 4 Azimuthally averaged radial profile of the disk potential (given in normalized units) at different evolutionary times sampled every 500 yrs. Some change in the potential is also due to the mass loss through the inner and outer borders of the computational grid. The two bottom plots illustrate the azimuthal variation, computed as |

3.3. The influence of the disk gravity unveiled
By inspecting Fig. 3, the first question that comes to mind is: is it the radial component of the gas drag force or the gravitational attraction of the disk that is responsible for the high values of the planetesimal eccentricities? To answer this question we run an additional model where the gravity of the disk on planetesimal is switched off. Figure 5 shows the difference in the two cases after 1 × 10³ yrs of evolution. The case with the gravity of the disk acting on planetesimals show much higher eccentricities than the test case without the disk gravity. Note that the eccentricity profile in the model where the disk perturbations are included differ from that shown in Fig. 3 since the evolutionary times are different (104 yr in Fig. 3 and 103 yr in Fig. 5).
While it is possible to analytically estimate the effects of a nonlinear gas drag due to an eccentric precessing gaseous disk (Beaugé et al. 2010), it is a prohibitive task trying to predict analytically the details of the gravitational perturbation of an asymmetric disk. The gravity field felt by each planetesimal is a combination of the tidal field of the binary stars, of the eccentric disk and of its spiral arms which are tightly wound close to the stars. Planetesimals are embedded well in the disk and then they are sensitive not only to the overall shape of the disk but also to its fast time variability. In Fig. 4 top panel we show azimuthally averaged radial profiles of the potential produced by the disk at different evolutionary times. To give an idea of the variation of the potential with azimuth we plot also the variation of the potential with azimuth respect to the local average value at two different times. The inner zone, within ~1.8 AU, show a slow decrease of the potential with a limited azimuthal variability. This is the region where the planetesimals are less excited in eccentricity. Just beyond 2 AU, the potential begins to rise and the dynamics of planetesimals reacts to this trend change with a steep increase in eccentricity. It is possibly the combination of radial and azimuthal variations that account for the sudden raise in the planetesimal eccentricity, even if it appears difficult to analytically predict the amount of perturbation felt by the planetesimal trajectories. This because the whole shape of the potential changes with time. In addition, there is no analytical expression available for the gravity field of an elliptic disk within itself. While the outside potential might be fit with the analytical expression derived by McCoullogh (Murray & Dermott 1999), inside the disk the task appears much more complex. Not only is a secular theory predicting the eccentricity perturbations of an elliptical disk on bodies located inside the disk itself intrinsically very complex but to make the task even more difficult the disk also changes with time and, as a consequence, also the potential, as shown in Fig. 4.
Even if the effects of the non-radial component of gas drag are not relevant in exciting high eccentricity values and the disk gravity does all the job, this does not mean that the gas drag can be neglected when modeling the planetesimal evolution. High values of eccentricity powers up the gas drag effect on the semimajor axis a since da/dt is proportional to e, as discussed in the previous section. As a consequence, the eccentricity excitation leads also to a fast inward migration related to the eccentricity value. Does the nonradial component of gas drag contributes at later times to excite the eccentricity to the values observed in Fig. 3a? When the eccentricity is excited by the disk gravity, the high value of η is mostly due to the radial velocity induced by the eccentric orbit of the planetesimal rather than the irregular value due to the disk. As a consequence, we expect again that the dominant term is the disk gravity and that gas drag still acts as a damping force. This is further confirmed by the case of 25 km size planetesimals discussed in the next section. It has to be noted that the simulations shown in Fig. 5 show the eccentricity value after 103 of evolution while those in Figs. 3 and 6 illustrate the eccentricity distribution at later times (104) when the planetesimal evolution reaches an almost stationary state.
 |
Fig. 5 Test run to verify the impact of the disk gravity on the planetesimal dynamics. The outcome of the full model is compared with that of a model without the gravitational attraction of the disk on planetesimals. In this second case the forced eccentricity is significantly reduced. The comparison is performed after 1000 yrs of evolution and for 5 km size planetesimals. |
3.4. Evolution of 25 km size planetesimals
As a further test that the disk gravity is responsible for the high eccentricity values of the planetesimals, we ran an additional simulation for larger bodies 25 km in radius. In Fig. 6 we compare the eccentricity and pericenter distribution of the two different size swarm. The eccentricities are much higher and in effect 5% of the bodies are injected in hyperbolic orbits. Their orbits, located in between 2−3 AU where the eccentricity excitation is the highest, are perturbed by the disk until they reach an eccentricity of about 0.6−0.7 so that, at pericenter, they come close to the binary. Repeated pericenter passages further pump up their eccentricity because of the interaction with the binary until a close encounter with the secondary star ejects them out of the system. In addition, the pericenters are not phased at all for large planetesimals. This is due to the reduced effect of the gas drag which was partly able to damp the eccentricities of the smaller 5 km size planetesimals but it is unable to perform this task for 25 km size bodies. As a consequence, the disk gravity is more effective for the large planetesimals in exciting their orbits.
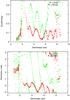 |
Fig. 6 In panel 1 we compare the distribution of the eccentricity vs. semimajor axis of 5 km and 25 km size (radius) planetesimals at t = 104 yrs. In panel 2 the distribution is that of the perihelion longitude vs. semimajor axis. |
3.5. Impact velocities
The dynamical behaviors identified in the previous sections have to be interpreted in terms of how they affect mutual accretion of planetesimals. The outcome of mutual planetesimal collisions depends on both their impact velocities and their respective sizes. Ideally, one would thus like to follow a whole population of planetesimals with a given size distribution and record all collisions for all impacting pairs of sizes R1 and R2. Unfortunately, because of the high CPU cost of computing planetesimal orbits in this sophisticated set-up, only 400 can be followed simultaneously. This is not enough to consider a size distribution amongst them and have enough statistics on dvR1,R2 everywhere in the disk. We thus considered 2 simplified cases where all planetesimals have the same size, one for “small” planetesimals with R = 5 km, and one with a “large” planetesimals with R = 25 km. The consequence of this simplification is to underestimate impact velocities among planetesimals, as gas drag tends to minimize these velocities for equal-sized impactors while increasing them for differentially-sized objects (Thébault et al. 2006). As such, our estimates should be considered as a best case (that is, accretion-friendly) scenario.
To derive an estimate of the mutual impact velocities between the “small” and “large” planetesimals orbiting the binary from the orbital parameters of the test bodies in our hybrid model, we used a post-processing code computing all possible crossings among the test planetesimals of our sample. For each pair of orbits, the code looks for the crossing location and computes the relative velocity from 2-body keplerian formulas. In this way we build up a statistical sample of possible impact velocities which characterize the planetesimal swarm around the binary. These velocities are then compared to the critical velocity vcrit(R), corresponding, for impacts between equal-sized bodies of size R, to the limiting value above which impacts result in net mass erosion instead of mass accretion. To derive vcrit(R), we use Eqs. (1) and (2) of Leinhardt & Stewart (2012), which lead to vcrit(5 km) ~ 25 m s-1 for 5 km size planetesimals and vcrit(25 km) ~ 125 m s-1 for 25 km size planetesimals.
 |
Fig. 7 Relative encounter velocities between planetesimals. In panel 1 we compare the relative velocities in the case of small planetesimals at different times. There is a significant time variability in the impact velocity which, however, remains high all the time. In panel 2 we illustrate the relative velocities for R = 25 km planetesimals at t = 104 yr. The black lines in both plots show the average impact velocity computed in small radial bins The 2 horizontal lines display the limiting Δv values for the accretion/erosion frontier, as deduced from Leinhardt & Stewart (2012), for 5 km impactors and 25 km ones. |
In Fig. 7 we show the relative velocities among equal size R = 5 km (upper panel) and R = 25 km (lower panel) planetesimals. We see that, for both cases, high values of impact speed are excited in the proximity of the inner border of the disk, i.e., below ~2 AU. This high velocity regime for equal-sized bodies is the direct consequence of the gas disk gravity, because pure gas drag would have lead to perfect orbital phasing for a given planetesimal size, and thus very low Δv for same size bodies. However, the effect of gas drag is still noticeable, as it is responsible for the fact that average Δv are higher for 25 km planetesimals, ~600−1200 m s-1, than for 5 km objects, ~200−400 m s-1. This difference can be unambiguously attributed to gas drag, as it is the only size-dependent mechanism acting on planetesimals, so that its damping effect on the eccentricity will be much more pronounced for smaller bodies. However, even for the small planetesimal run, velocities are still much higher than the critical value for erosion vcrit(5 km) ~ 25 m s-1. This is also true for 25 km planetesimals, despite of the fact that vcrit(5 km) is higher, ~125 m s-1.
The high-Δv regime is maintained, for all planetesimal sizes, in the strongly-depleted region between 2 and 3.5 AU. It is followed by a region, between ~3.5 and ~5.5 AU, of lower impact velocities for the small planetesimal case. However, these velocities remain above the erosion threshold, except for a very narrow region around 4 AU, where ⟨ Δv ⟩ ~ vcrit. For the larger 25 km planetesimals, impact speeds are ≥300 m s-1, and thus higher than vcrit, in this whole intermediate region.
In the outer regions of the simulations, up to 10 AU, impact velocities become comparable for both planetesimal populations. Their values remain relatively high, in the ~100−200 m s-1 range, and are above the erosion threshold everywhere, except for the outermost 8.5−10 AU domain, where ⟨ Δv ⟩ become slightly lower than vcrit for 25 km objects.
4. Discussion and conclusions
The discovery by Kepler of planets in circumbinary orbits has reawaken the interest regarding the planetesimal accumulation process in such systems. The first numerical investigations of this issue adopted an axisymmetric approximation for the gas disk in which planetesimal are imbedded, implicitly assuming that the tidal force of the central binary does not significantly perturbs this disk. We show in this paper that this is not the case and, due to the presence of the companion star, the circumbinary gas disk becomes eccentric. This has profound implications for the accumulation process of planetesimals due to the excitation of their orbital eccentricity and partial destruction of the perihelia alignment. Our simulations where the disk is evolved together with the planetesimals indeed show that, adding the crucial effect of the gas disk gravity greatly increases impact velocities amongst planetesimals in the circumbinary disk around Kepler 16. For the two planetesimal populations we have considered, 5 and 25 km, the environment is globally very hostile to mutual accretion in the region within 10 AU.
As noted earlier, we have considered a simplified case where all bodies have the same size, so that only a small fraction of all possible planetesimal encounters have been explored. However, in the regions where gas drag has a non-negligible effect on mutual impacting speeds, we expect impact velocities between differentially-sized bodies to be even higher than those amongst equal-sized ones (e.g. Thébault et al. 2006). As a consequence, in these regions our runs probably display a best-case scenario, with a situation that would be even more accretion-hostile in a “real” system with a spread in planetesimal sizes. The r ≤ 6 AU domain clearly corresponds to this case, the important difference between Δv5 km and Δv25 km being a clear indicator that gas drag is an important factor in imposing the impact speeds. In the region beyond 6 AU, impact speeds for 5 km and 25 km bodies are comparable, which could at first glance indicate that gas drag has a limited effect there. However, Fig. 6 clearly shows that it is not the case, since these two populations have very different eccentricities and periastron in these outer regions, so that gas drag still has an important influence on collision velocities and the fact that Δv5 km ~ Δv25 km is simply a coincidence. We thus here also expect impact speeds to be higher between differentially-sized objects than for equal-sized ones, so that our single-sized simulations here again probably correspond to the most accretion-friendly configuration possible. The fact that even in this best-case scenario the whole disk below ~9 AU is strongly hostile to accretion, with the possible exception of a narrow strip around 4 AU, seems to indicate that this result should also hold for any planetesimal population with a spread in its size distributions. Furthermore, even if accretion was to be possible, it is important to stress that it cannot be as efficient as in an unperturbed case. Indeed, planetesimal accumulation will be slowed down, because of the increased encounter velocities due to perturbations which would probably switch off the fast runaway-growth mode that requires very low impact velocities to proceed (see discussion in Thebault 2011).
Our results should, however, be taken with some caution, as one potentially important effect is not accounted for in our runs, that of the possible re-accretion of collisional fragments that has been identified by Paardekooper et al. (2012). This mechanism would probably help planetesimal growth in this dynamically excited environment, so that its omission overestimates the erosive behavior of the disk. Unfortunately, it is impossible to implement this effect in the already very complex set-up that has been considered here. We note, however, that other simplifications of our numerical approach might have the opposite effect, i.e., underestimating the erosive nature of the planetesimal swarm. The first one is that we suppose that all planetesimal start on circular orbits at the same time, whereas there might be a spread in their formation epoch (e.g. Xie et al. 2010b). Such a spread would lead to increased differential orbits, and thus impact speeds, even between equal-sized objects (Paardekooper et al. 2012). The other simplification is that the spatial resolution in the hydrodynamical model required to correctly compute the disk-planetesimal interactions limits the radial extension of the disk we can model with a reasonable CPU load. Our gas disk is thus probably too small, and we would expect a larger and more massive disk to have more powerful gravitational perturbations on the planetesimal trajectories, possibly increasing the impact velocities.
Given these uncertainties, it is thus too early to reach definitive conclusion regarding the precise balance between accretion and erosion in a realistic planetesimal disk. However, to the very least our simulations have shown that disk gravity plays a crucial role and always act toward increasing impact speeds and the erosive behavior of the swarm. As such, they strengthen and expand the results obtained by previous works, which already identified that the region where the planet is located is hostile to planetesimal accretion (Meschiari 2012; Paardekooper et al. 2012). This seems to rule out the in situ formation of the Kepler 16 planet following the core-accretion scenario. This result also probably holds for the Kepler-34, Kepler-35 and Kepler-47 planets, given the similarities between these different systems.
A possibility to explain the present position of these planets is that they formed farther out in the circumbinary disk. Subsequent migration due to the interaction with the disk would have brought them back to their present orbits, as shown in (Pierens & Nelson 2007, 2008). This is also suggested by their mass which is in the Neptune-Saturn range, in agreement with the prediction of (Pierens & Nelson 2007, 2008). Jupiter size planets in fact would be either ejected from the system or sent on outer orbits. Our simulations show that such migration would have to be very efficient, bringing the planet where it is today from an initial formation region probably located beyond 6 AU from the binary’s center of mass.
An alternative scenario may be based on the direct formation of large planetesimals from the accumulation of small solid particles in turbulent structures of the gaseous disk (Johansen et al. 2007; Cuzzi et al. 2008). In circumbinary disks the onset of turbulence may be favored by the tidal gravity field of the central stars and this might lead to the formation of planetesimal large enough to sustain the high velocity impacts occurring in the inner regions of the disk. In this case, planets might form closer to the center of the disk by-passing the critical phase of small body accretion. However, these instability-based scenarios still need to be quantitatively investigated in dynamically perturbed environments such as binaries before any conclusion can be reached.
Acknowledgments
We thank an anonymous referee for comments and suggestions.
References
- Adachi, I., Hayashi, C., & Nakazawa, K. 1976, Prog. Theor. Phys., 56, 1756 [NASA ADS] [CrossRef] [Google Scholar]
- Baruteau, C., & Masset, F. 2008, ApJ, 672, 1054 [NASA ADS] [CrossRef] [Google Scholar]
- Beaugé, C., Leiva, A. M., Haghighipour, N., & Otto, J. C. 2010, MNRAS, 408, 503 [NASA ADS] [CrossRef] [Google Scholar]
- Bell, K. R., & Lin, D. N. C. 1994, ApJ, 427, 987 [NASA ADS] [CrossRef] [Google Scholar]
- Bitsch, B., Crida, A., Morbidelli, A., Kley, W., & Dobbs-Dixon, I. 2013, A&A, 549, A124 [NASA ADS] [CrossRef] [EDP Sciences] [Google Scholar]
- Boley, A. C., Durisen, R. H., & Pickett, M. K. 2005, in Chondrites and the Protoplanetary Disk, eds. A. N. Krot, E. R. D. Scott, & B. Reipurth, ASP Conf. Ser., 341, 839 [Google Scholar]
- Cuzzi, J. N., Hogan, R. C., & Shariff, K. 2008, ApJ, 687, 1432 [NASA ADS] [CrossRef] [Google Scholar]
- Doyle, L. R., Carter, J. A., Fabrycky, D. C., et al. 2011, Science, 333, 1602 [NASA ADS] [CrossRef] [MathSciNet] [PubMed] [Google Scholar]
- Duchêne, G. 2010, ApJ, 709, L114 [NASA ADS] [CrossRef] [Google Scholar]
- Günther, R., & Kley, W. 2002, A&A, 387, 550 [NASA ADS] [CrossRef] [EDP Sciences] [MathSciNet] [Google Scholar]
- Holman, M. J., & Wiegert, P. A. 1999, AJ, 117, 621 [NASA ADS] [CrossRef] [Google Scholar]
- Hubeny, I. 1990, ApJ, 351, 632 [NASA ADS] [CrossRef] [Google Scholar]
- Johansen, A., Oishi, J. S., Mac Low, M.-M., et al. 2007, Nature, 448, 1022 [Google Scholar]
- Kley, W., & Nelson, R. P. 2008, A&A, 486, 617 [NASA ADS] [CrossRef] [EDP Sciences] [Google Scholar]
- Kley, W., Papaloizou, J. C. B., & Ogilvie, G. I. 2008, A&A, 487, 671 [NASA ADS] [CrossRef] [EDP Sciences] [Google Scholar]
- Leinhardt, Z. M., & Stewart, S. T. 2012, ApJ, 745, 79 [NASA ADS] [CrossRef] [Google Scholar]
- Lubow, S. H., & Ogilvie, G. I. 1998, ApJ, 504, 983 [NASA ADS] [CrossRef] [Google Scholar]
- Marzari, F., & Scholl, H. 2000, ApJ, 543, 328 [NASA ADS] [CrossRef] [Google Scholar]
- Marzari, F., Thébault, P., & Scholl, H. 2008, ApJ, 681, 1599 [NASA ADS] [CrossRef] [Google Scholar]
- Marzari, F., Scholl, H., Thébault, P., & Baruteau, C. 2009a, A&A, 508, 1493 [NASA ADS] [CrossRef] [EDP Sciences] [Google Scholar]
- Marzari, F., Thébault, P., & Scholl, H. 2009b, A&A, 507, 505 [NASA ADS] [CrossRef] [EDP Sciences] [Google Scholar]
- Marzari, F., Baruteau, C., Scholl, H., & Thebault, P. 2012, A&A, 539, A98 [NASA ADS] [CrossRef] [EDP Sciences] [Google Scholar]
- Masset, F. S. 2000, in Disks, Planetesimals, and Planets, eds. G. Garzón, C. Eiroa, D. de Winter, & T. J. Mahoney, ASP Conf. Ser., 219, 75 [Google Scholar]
- Meschiari, S. 2012, ApJ, 752, 71 [NASA ADS] [CrossRef] [Google Scholar]
- Moriwaki, K., & Nakagawa, Y. 2004, ApJ, 609, 1065 [NASA ADS] [CrossRef] [Google Scholar]
- Müller, T. W. A., & Kley, W. 2012, A&A, 539, A18 [NASA ADS] [CrossRef] [EDP Sciences] [Google Scholar]
- Murray, C. D., & Dermott, S. F. 1999, Solar system dynamics [Google Scholar]
- Nelson, R. P., & Gressel, O. 2010, MNRAS, 409, 639 [NASA ADS] [CrossRef] [Google Scholar]
- Orosz, J. A., Welsh, W. F., Carter, J. A., et al. 2012, Science, 337, 1511 [NASA ADS] [CrossRef] [PubMed] [Google Scholar]
- Paardekooper, S.-J., & Leinhardt, Z. M. 2010, MNRAS, 403, L64 [NASA ADS] [Google Scholar]
- Paardekooper, S.-J., Thébault, P., & Mellema, G. 2008, MNRAS, 386, 973 [NASA ADS] [CrossRef] [Google Scholar]
- Paardekooper, S., Baruteau, C., & Kley, W. 2011, MNRAS, 410, 293 [NASA ADS] [CrossRef] [Google Scholar]
- Paardekooper, S.-J., Leinhardt, Z. M., Thébault, P., & Baruteau, C. 2012, ApJ, 754, L16 [NASA ADS] [CrossRef] [Google Scholar]
- Payne, M. J., Wyatt, M. C., & Thébault, P. 2009, MNRAS, 400, 1936 [NASA ADS] [CrossRef] [Google Scholar]
- Pelupessy, F. I., & Portegies Zwart, S. 2013, MNRAS, 429, 895 [NASA ADS] [CrossRef] [Google Scholar]
- Pierens, A., & Nelson, R. P. 2007, A&A, 472, 993 [NASA ADS] [CrossRef] [EDP Sciences] [Google Scholar]
- Pierens, A., & Nelson, R. P. 2008, A&A, 483, 633 [NASA ADS] [CrossRef] [EDP Sciences] [Google Scholar]
- Rafikov, R. R. 2013, ApJ, 764, L16 [NASA ADS] [CrossRef] [Google Scholar]
- Shakura, N. I., & Sunyaev, R. A. 1973, A&A, 24, 337 [NASA ADS] [Google Scholar]
- Thebault, P. 2011, Celest. Mech. Dyn. Astron., 111, 29 [NASA ADS] [CrossRef] [Google Scholar]
- Thébault, P., Marzari, F., Scholl, H., Turrini, D., & Barbieri, M. 2004, A&A, 427, 1097 [NASA ADS] [CrossRef] [EDP Sciences] [Google Scholar]
- Thébault, P., Marzari, F., & Scholl, H. 2006, Icarus, 183, 193 [NASA ADS] [CrossRef] [Google Scholar]
- Thébault, P., Marzari, F., & Scholl, H. 2008, MNRAS, 388, 1528 [NASA ADS] [CrossRef] [Google Scholar]
- Thébault, P., Marzari, F., & Scholl, H. 2009, MNRAS, 393, L21 [NASA ADS] [CrossRef] [Google Scholar]
- Welsh, W. F., Orosz, J. A., Carter, J. A., et al. 2012, Nature, 481, 475 [NASA ADS] [CrossRef] [PubMed] [Google Scholar]
- Xie, J.-W., & Zhou, J.-L. 2009, ApJ, 698, 2066 [NASA ADS] [CrossRef] [Google Scholar]
- Xie, J.-W., Payne, M. J., Thébault, P., Zhou, J.-L., & Ge, J. 2010a, ApJ, 724, 1153 [NASA ADS] [CrossRef] [Google Scholar]
- Xie, J.-W., Zhou, J.-L., & Ge, J. 2010b, ApJ, 708, 1566 [NASA ADS] [CrossRef] [Google Scholar]
All Figures
|
Fig. 1 Azimuthally and time averaged (200 yr) temperature profile of our radiative model at t = 10 000 yr (continuous red line) compared with the initial t = 0 yr nonequilibrium one (dashed green line) and the isothermal temperature profile adopted by Pelupessy & Portegies Zwart (2013) (dotted blue line). |
| In the text | |
|
Fig. 2 Upper panel: isocurves of the disk density distribution (in normalized units) after 2 × 10⁵ binary revolutions illustrating the eccentric shape of the disk. Bottom panel: azimuthally-averaged disk eccentricity is drawn as a function of the radial distance at 3 different evolutionary times separated by 200 yr. |
| In the text | |
|
Fig. 3 Upper panel: distribution of the eccentricity vs. semimajor axis of 5 km size (radius) planetesimals at two different times. Bottom panel: distribution is that of the perihelion longitude vs. semimajor axis. |
| In the text | |
|
Fig. 4 Azimuthally averaged radial profile of the disk potential (given in normalized units) at different evolutionary times sampled every 500 yrs. Some change in the potential is also due to the mass loss through the inner and outer borders of the computational grid. The two bottom plots illustrate the azimuthal variation, computed as |
| In the text | |
|
Fig. 5 Test run to verify the impact of the disk gravity on the planetesimal dynamics. The outcome of the full model is compared with that of a model without the gravitational attraction of the disk on planetesimals. In this second case the forced eccentricity is significantly reduced. The comparison is performed after 1000 yrs of evolution and for 5 km size planetesimals. |
| In the text | |
|
Fig. 6 In panel 1 we compare the distribution of the eccentricity vs. semimajor axis of 5 km and 25 km size (radius) planetesimals at t = 104 yrs. In panel 2 the distribution is that of the perihelion longitude vs. semimajor axis. |
| In the text | |
|
Fig. 7 Relative encounter velocities between planetesimals. In panel 1 we compare the relative velocities in the case of small planetesimals at different times. There is a significant time variability in the impact velocity which, however, remains high all the time. In panel 2 we illustrate the relative velocities for R = 25 km planetesimals at t = 104 yr. The black lines in both plots show the average impact velocity computed in small radial bins The 2 horizontal lines display the limiting Δv values for the accretion/erosion frontier, as deduced from Leinhardt & Stewart (2012), for 5 km impactors and 25 km ones. |
| In the text | |
Current usage metrics show cumulative count of Article Views (full-text article views including HTML views, PDF and ePub downloads, according to the available data) and Abstracts Views on Vision4Press platform.
Data correspond to usage on the plateform after 2015. The current usage metrics is available 48-96 hours after online publication and is updated daily on week days.
Initial download of the metrics may take a while.