Free Access
Fig. 1
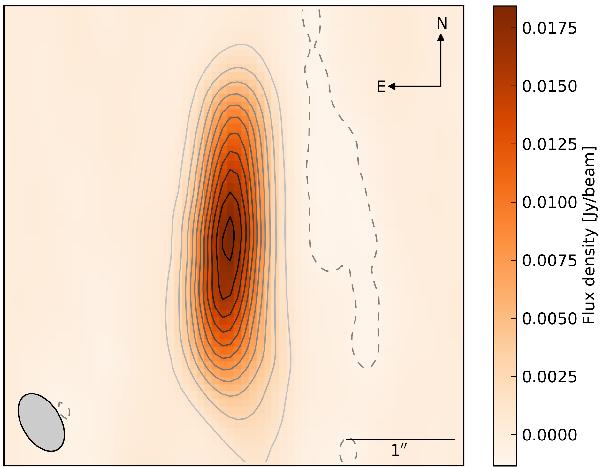
1.3 mm map obtained with the PdBI. Negative contours are dashed and at –3σ, where σ is the background noise of the map. The positive contour levels are in steps of 5σ starting at 3σ and going up to 53σ. The ellipse in the bottom left illustrates the shape and orientation of the beam.
Current usage metrics show cumulative count of Article Views (full-text article views including HTML views, PDF and ePub downloads, according to the available data) and Abstracts Views on Vision4Press platform.
Data correspond to usage on the plateform after 2015. The current usage metrics is available 48-96 hours after online publication and is updated daily on week days.
Initial download of the metrics may take a while.