Fig. 8
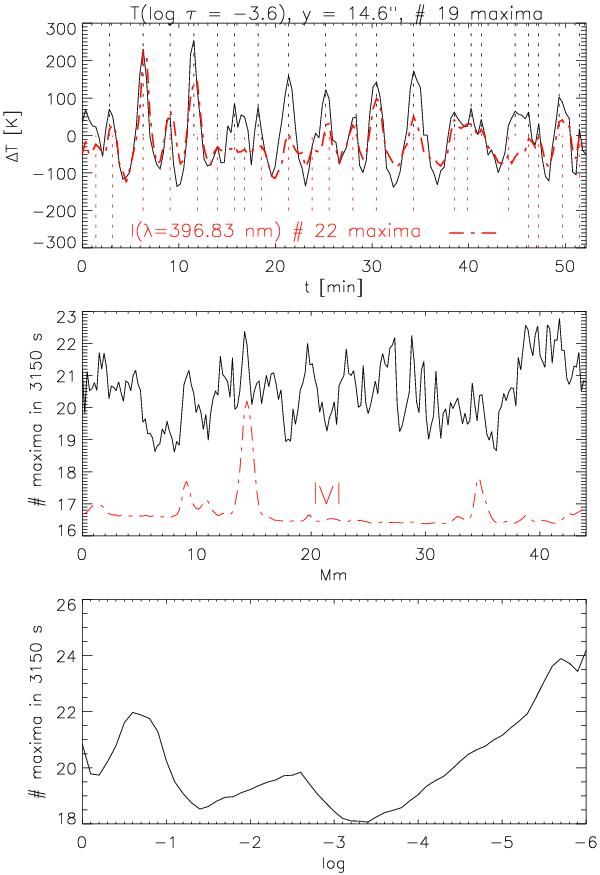
Temporal occurrence frequency of BG events. Top: temporal evolution of temperature at log τ = −3.6 for one pixel along the slit. The red-dash-dotted line shows the intensity at λ = 396.83 nm in arbitrary units for comparison. The vertical dashed lines indicate local maxima. Middle: temporal average of number of maxima along the slit. The red-dash-dotted line shows the unsigned integrated Stokes V signal in arbitrary units. Bottom: average number of local maxima during 3150 s as a function of log τ.
Current usage metrics show cumulative count of Article Views (full-text article views including HTML views, PDF and ePub downloads, according to the available data) and Abstracts Views on Vision4Press platform.
Data correspond to usage on the plateform after 2015. The current usage metrics is available 48-96 hours after online publication and is updated daily on week days.
Initial download of the metrics may take a while.