Fig. 6
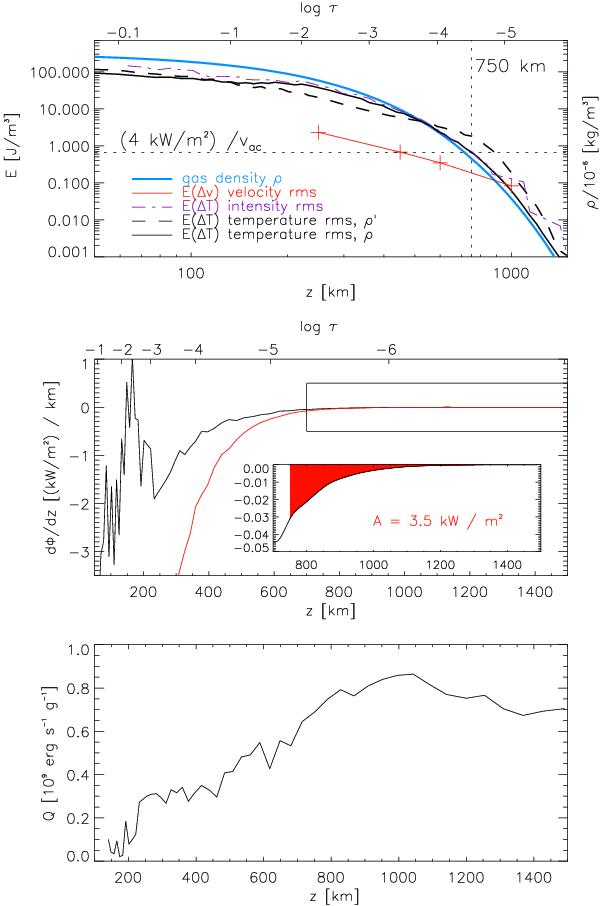
Variation of energy density with height. Top: energy density equivalents corresponding to velocity (red line with pluses), intensity (purple-dash-dotted line), and temperature rms fluctuations (black-solid line). The black-dashed line shows results for the temperature rms fluctuations when using the gas density in the original HSRA model. The blue line indicates the gas density in the modified HSRA model. Middle: energy gradient per km in height assuming a propagation with vac. The red line shows results from using a net cooling rate of 100 W g-1 (CL12). Bottom: radiative losses in the units used in CL12.
Current usage metrics show cumulative count of Article Views (full-text article views including HTML views, PDF and ePub downloads, according to the available data) and Abstracts Views on Vision4Press platform.
Data correspond to usage on the plateform after 2015. The current usage metrics is available 48-96 hours after online publication and is updated daily on week days.
Initial download of the metrics may take a while.