Fig. 2
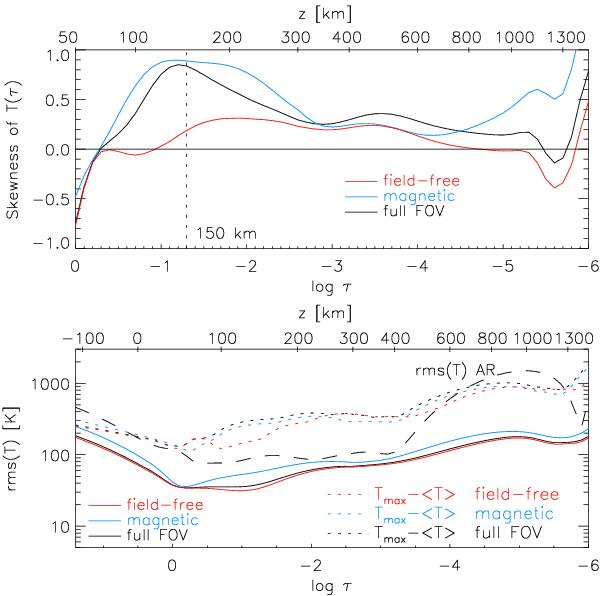
Bottom panel: rms fluctuations of temperature for the full FOV (black line), field-free locations (red line), and magnetic locations (blue line). The three dotted lines indicate the maximum deviation from the average temperature. The dashed line denotes the rms fluctuation in an AR map. Top panel: skewness of the temperature distributions. The vertical dotted line indicates z = 150 km.
Current usage metrics show cumulative count of Article Views (full-text article views including HTML views, PDF and ePub downloads, according to the available data) and Abstracts Views on Vision4Press platform.
Data correspond to usage on the plateform after 2015. The current usage metrics is available 48-96 hours after online publication and is updated daily on week days.
Initial download of the metrics may take a while.