Fig. 16
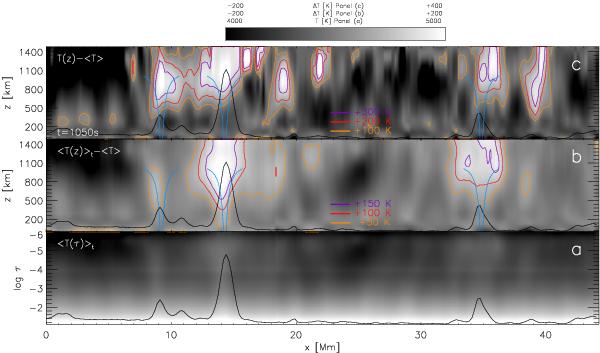
Spatial temperature and velocity maps of the time series. Panel a) temporally averaged temperature ⟨ T ⟩ t vs. optical depth. Panel b) ⟨ T ⟩ t minus temporally and spatially averaged temperature stratification ⟨ T ⟩ vs. geometrical height. Panel c) temperature at one scan step minus ⟨ T ⟩ vs. geometrical height. The z-axis in the panels b) and c) is stretched by a factor of five relative to the x-axis. The black lines at the lower border of each panel denote the total circular polarisation along the slit in arbitrary units. The blue lines show one flux tube model of SO91. The orange/red/purple contours in panel b) mark temperature excesses of 50, 100 and 150 K, while in panel c) they denote temperature excesses of 100, 200 and 300 K.
Current usage metrics show cumulative count of Article Views (full-text article views including HTML views, PDF and ePub downloads, according to the available data) and Abstracts Views on Vision4Press platform.
Data correspond to usage on the plateform after 2015. The current usage metrics is available 48-96 hours after online publication and is updated daily on week days.
Initial download of the metrics may take a while.