Free Access
Fig. 12
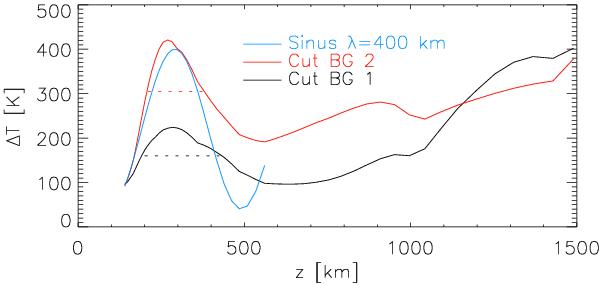
Temperature stratifications vs. geometrical height at the onset of two BGs corresponding to the vertical white-dotted lines in the top panel of Fig. 10. The horizontal dotted lines denote the FWHM of the BG events. The blue line shows a sine curve with a wavelength of 400 km for comparison.
Current usage metrics show cumulative count of Article Views (full-text article views including HTML views, PDF and ePub downloads, according to the available data) and Abstracts Views on Vision4Press platform.
Data correspond to usage on the plateform after 2015. The current usage metrics is available 48-96 hours after online publication and is updated daily on week days.
Initial download of the metrics may take a while.