Fig. 11
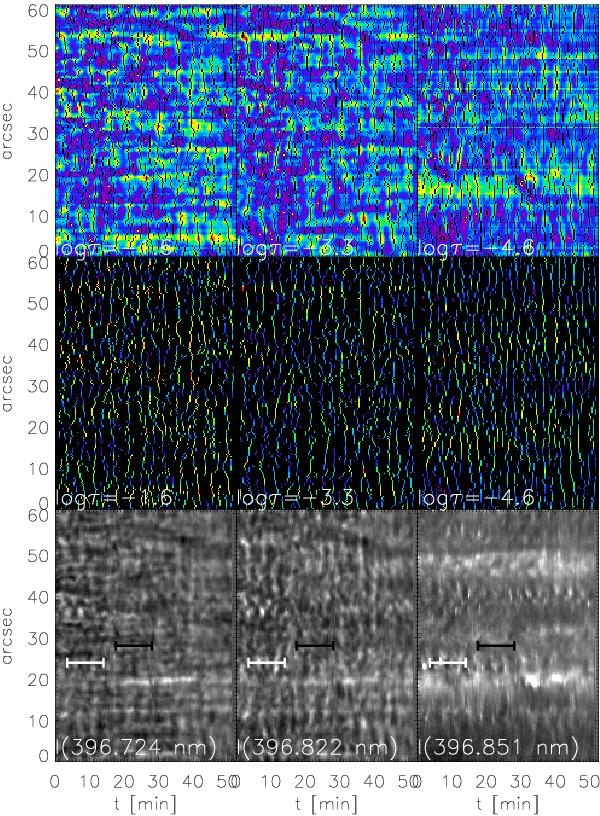
Spatio-temporal occurrence of temperature maxima. Bottom row, left to right: intensity maps at λ = 396.724, 396.822, and 396.851 nm. The horizontal white/black bars mark the locations of the active/reference pixel used before. Middle row, left to right: energy density at heights of log τ = −1.6, −3.3, and − 4.6 at the time of temperature maxima. Top: complementary map of energy density on all other locations.
Current usage metrics show cumulative count of Article Views (full-text article views including HTML views, PDF and ePub downloads, according to the available data) and Abstracts Views on Vision4Press platform.
Data correspond to usage on the plateform after 2015. The current usage metrics is available 48-96 hours after online publication and is updated daily on week days.
Initial download of the metrics may take a while.