Fig. 10
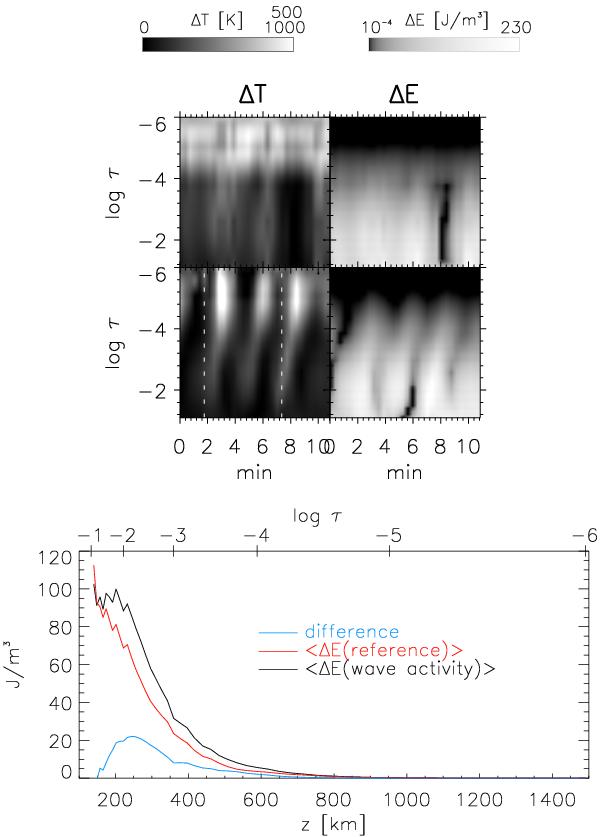
Estimate of the energy content of individual BG events. Top panel: temperature enhancements (left column) and internal energy enhancements (right column) for a pixel with BG activity (bottom row) and a quiet reference pixel (top row). Bottom panel: average internal energy density for the active (black line) and the quiet pixel (red line) vs. geometrical height. The blue line shows their difference.
Current usage metrics show cumulative count of Article Views (full-text article views including HTML views, PDF and ePub downloads, according to the available data) and Abstracts Views on Vision4Press platform.
Data correspond to usage on the plateform after 2015. The current usage metrics is available 48-96 hours after online publication and is updated daily on week days.
Initial download of the metrics may take a while.