Fig. 5
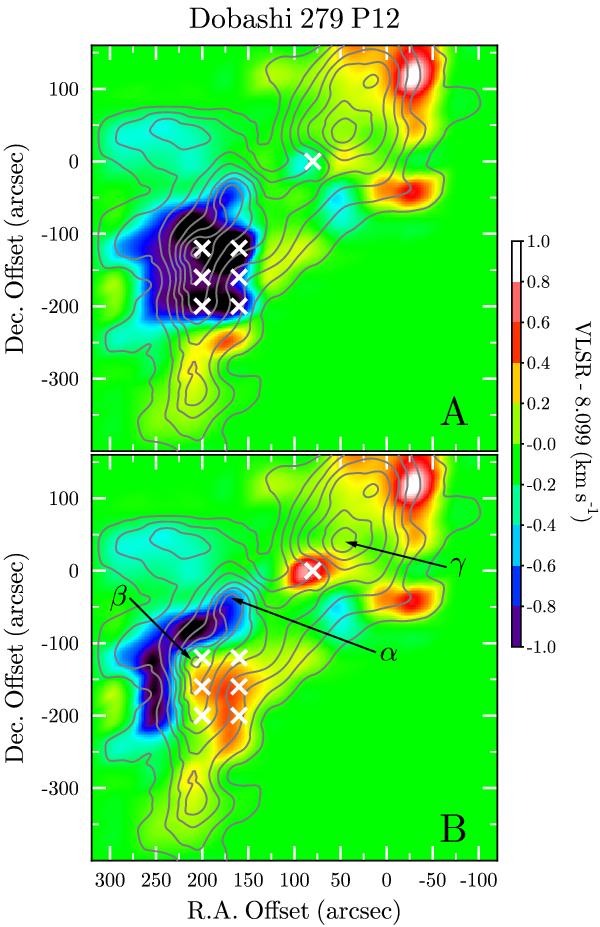
NH3(1, 1) intensity (grey contours) and radial velocity (color map) structure in the source Do279P12. The velocity field is shown after subtracting the mean radial velocity ⟨ VLSR ⟩ = 8.099 km s-1. The contour levels are the same as in Fig. 4a. Panels A) and B) represent the velocity maps for the components A and B in the NH3 profile, respectively (see Fig. B.4). The white crosses mark offsets where the splitting of the NH3 profiles is detected. The mean radial velocities of the components A and B are ⟨ VA ⟩ = 7.27 ± 0.11 km s-1 and ⟨ VB ⟩ = 8.54 ± 0.08 km s-1. In panel B), the intensity peaks are labeled as in Table 1.
Current usage metrics show cumulative count of Article Views (full-text article views including HTML views, PDF and ePub downloads, according to the available data) and Abstracts Views on Vision4Press platform.
Data correspond to usage on the plateform after 2015. The current usage metrics is available 48-96 hours after online publication and is updated daily on week days.
Initial download of the metrics may take a while.