Fig. 2
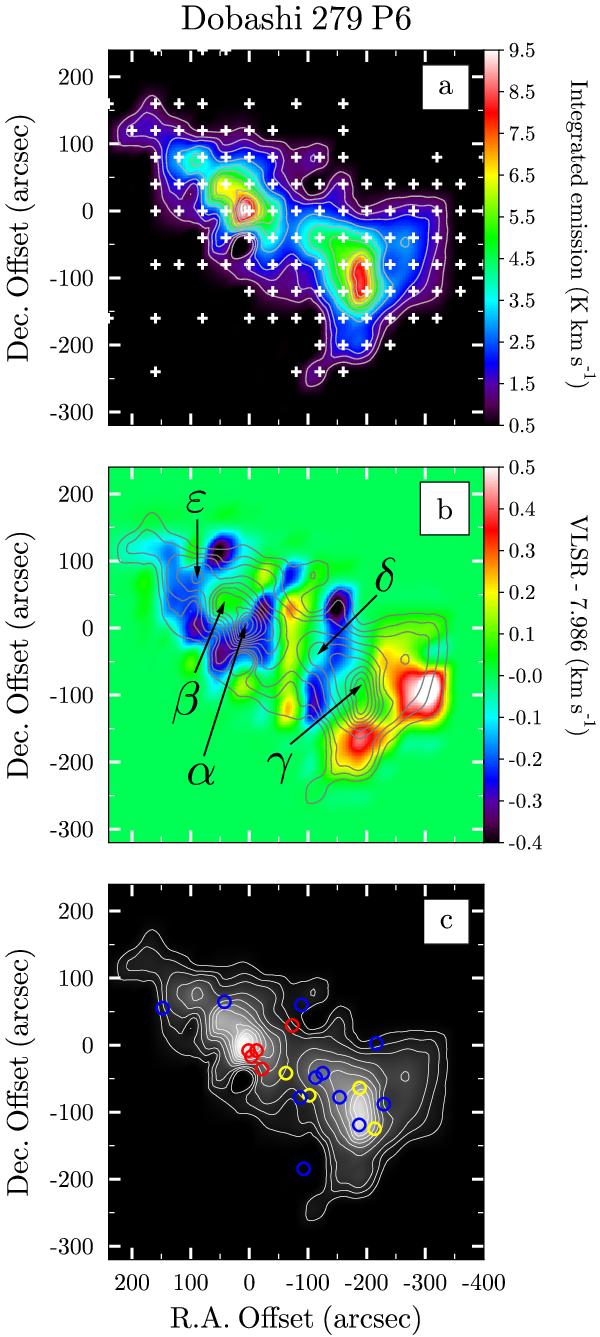
a) Same as Fig. 1a but for the source Do279P6. The starting point for the contour levels is 0.5 K km s-1, the increment is 0.5 K km s-1 between the first two and 1.0 K km s-1 between the other contour levels. b) NH3(1, 1) radial velocity (color map) structure. The velocity field is shown after subtracting the mean radial velocity ⟨ VLSR ⟩ = 7.986 km s-1. The intensity peaks are labeled as in Table 1. c) NH3(1, 1) intensity map as in panel a) and positions of YSO candidates observed with the Spitzer/IRAC in a star formation region Serpens cluster B (Harvey et al. 2006). Open circles of different colors mark Class I (red), intermediate type (yellow), and Class II (blue) YSOs.
Current usage metrics show cumulative count of Article Views (full-text article views including HTML views, PDF and ePub downloads, according to the available data) and Abstracts Views on Vision4Press platform.
Data correspond to usage on the plateform after 2015. The current usage metrics is available 48-96 hours after online publication and is updated daily on week days.
Initial download of the metrics may take a while.