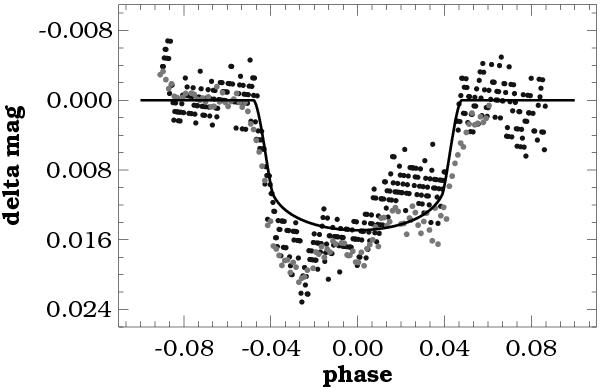
Fig. 8

Example of the consistency of followup observations made on the same date of 2012-01-01/02 by different observers. This is an example of a “strongly discrepant” transit. Lighter dots are for the data of Ramon Naves (ETD), whereas the heavier ones for those of Jordi Lopesino (ETD). Continuous line shows the model fit to the grand-averaged transit light curve. The agreement between the two datasets is very good which indicates that the large transit anomaly might be real.
Current usage metrics show cumulative count of Article Views (full-text article views including HTML views, PDF and ePub downloads, according to the available data) and Abstracts Views on Vision4Press platform.
Data correspond to usage on the plateform after 2015. The current usage metrics is available 48-96 hours after online publication and is updated daily on week days.
Initial download of the metrics may take a while.


