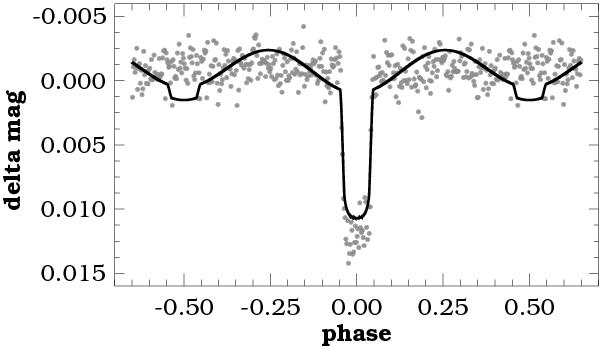
Fig. 4

Folded/binned HATNet light curve of WASP-33 (dots) vs the best-fitting blend model (continuous line). There are 400 bins throughout the full orbital period. The standard deviations of the bin averages are very similar, they scatter around 0.8–1.2 mmag. The large out of transit variation of the presumed blended eclipsing binary excludes the possibility of a blend scenario by very high significance.
Current usage metrics show cumulative count of Article Views (full-text article views including HTML views, PDF and ePub downloads, according to the available data) and Abstracts Views on Vision4Press platform.
Data correspond to usage on the plateform after 2015. The current usage metrics is available 48-96 hours after online publication and is updated daily on week days.
Initial download of the metrics may take a while.


