| Issue |
A&A
Volume 552, April 2013
|
|
|---|---|---|
| Article Number | A51 | |
| Number of page(s) | 5 | |
| Section | Stellar structure and evolution | |
| DOI | https://doi.org/10.1051/0004-6361/201321085 | |
| Published online | 21 March 2013 | |
A very long baseline interferometry detection of the class I protostar IRS 5 in Corona Australis
1
The Netherlands Institute for Radio Astronomy (ASTRON),
7990-
AA Dwingeloo
The Netherlands
e-mail:
This email address is being protected from spambots. You need JavaScript enabled to view it.
2
University of Vienna, Department of Astrophysics,
Türkenschanzstraße 17,
1180
Vienna,
Austria
3
Harvard–Smithsonian Center for Astrophysics, 60 Garden
Street, Cambridge,
MA
02138,
USA
4
Centro de Radiostronomía y Astrofísica, Universidad Nacional
Autónoma de México, 58089
Morelia, Michoacán, Mexico
5
Max-Planck–Institut für Radioastronomie,
Auf dem Hügel 69, 53121
Bonn,
Germany
Received: 11 January 2013
Accepted: 8 February 2013
Abstract
Aims. Very long baseline interferometry yields physical constraints on the compact radio emission of young stellar objects. At the same time, such measurements can be used for precise astrometric measurements of parallaxes and proper motions. Here, we aimed to make the first detections of very compact radio emission from class I protostars in the Corona Australis star-forming region.
Methods. We have used the Long Baseline Array (LBA) to observe the protostars IRS 5 and IRS 7 in the Corona Australis star-forming region in three separate epochs.
Results. We report the first firm radio detection of a class I protostar using very long baseline interferometry. We have detected the previously known non-thermal source IRS 5b, part of a binary system. IRS 5a and IRS 5N were undetected, as were all sources in the IRS 7 region.
Conclusions. These results underline the unusual nature of IRS 5b as a genuine protostar with confirmed non-thermal radio emission. Also, these observations highlight the potential of the LBA as a tool to provide precision astrometric measurements of individual young stellar objects in southern star-forming regions that are not accessible to the Very Long Baseline Array in the northern hemisphere.
Key words: stars: protostars / radio continuum: stars / astrometry / techniques: high angular resolution
© ESO, 2013
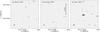 |
Fig. 1 Naturally weighted 3.6 cm LBA images of CrA IRS 5 at the three observed epochs. The synthesized beam is shown in the lower left corner of each image. The contours show −3, +3, 5, 7, 9, and 11σ, where σ is the noise level in each image (65, 75, and 27 μJy in the three images, respectively.) The scale bar in AU assumes a distance of 130 pc. |
1. Introduction
Young stellar objects (YSOs) are known to be radio emitters in essentially all evolutionary stages, usually grouped into classes 0–III. The earliest stages appear as class 0/I protostars, followed by disk-dominated class II objects (classical T Tauri stars), with essentially diskless class III sources (also known as weak-line T Tauri stars) representing the final pre-main sequence stage (Lada 1987; André et al. 1993). In the past, it has not always been easy to disentangle thermal and non-thermal components to this emission. While many YSOs show thermal emission from ionized material in jets or at the base of outflows, only very few are confirmed non-thermal sources. An unambiguous sign of non-thermal emission is the detection of circular polarization from gyrosynchrotron or linear polarization from synchrotron radiation. A direct determination of high brightness temperatures is an unambiguous sign of non-thermal emission as well. Strong variability is a hint of non-thermal emission, as are negative spectral indices (α < −0.1, where Sν ∝ να; André 1996), but their interpretation is less straightforward (Güdel 2002).
Non-thermal emission has been detected toward only a handful of YSOs. At radio wavelengths, circular polarization toward T Tauri stars was first found by White et al. (1992) and linear polarization was found by Phillips et al. (1996). In earlier evolutionary stages, the first detection of circularly polarized emission toward a class I protostar was reported by Feigelson et al. (1998). The target was CrA IRS 5, and this source is essentially still unique in its properties today. The low number of known non-thermal sources among YSOs could be due to the fact that magnetospheric emission is expected to be easily concealed by free-free absorption by ionized material along the line of sight (André 1987).
Very long baseline interferometry (VLBI) radio observations yield direct determinations or limits on the brightness temperature of YSOs and thus constitute an important tool in this field. While an obvious target, CrA IRS 5 is too far south (δ ≃ −37°) to be easily observable with the NRAO Very Long Baseline Array (VLBA). The most prominent YSO studied with VLBI techniques so far is the T Tau system, particularly its southern component which is itself a multiple system and where non-thermal radio emission is clearly detected (Phillips et al. 1993; Smith et al. 2003; Johnston et al. 2004; Loinard et al. 2007a,b) from one of the components (T Tau Sb). However, detailed infrared observations (Duchêne et al. 2005) have shown that the radio emitting object is most likely a very embedded classical T Tauri star rather than a protostellar source. A more robust case is that of the proto-Herbig Ae/Be object EC95 in the Serpens core (Preibisch 1999; Dzib et al. 2010). There, non-thermal radio emission was clearly detected in VLBA observations from the two components of a tight binary system (Dzib et al. 2010). However, while it is clearly a very young stellar system, EC95 is of intermediate mass so classifying it as Class I is somewhat improper. In an attempt to find more such sources, Forbrich et al. (2007a) marginally detected the Ophiuchus source YLW 15 in VLBI observations, but higher signal-to-noise observations would be needed to confirm this detection.
IRS 5 in Corona Australis was first reported when Taylor & Storey (1984) discovered the embedded Coronet cluster close to the Herbig Ae star R CrA in near-infrared observations. The distance to this region is ~130 pc (Casey et al. 1998; for a further discussion, see Neuhäuser & Forbrich 2008). IRS 5 has been found to be a close binary by Chen & Graham (1993), with a separation of ~0 6 or ~78 AU in Very Large Telescope imaging obtained by Nisini et al. (2005). The latter authors also reported a spectral type of K5–7V for the brighter component, IRS 5a. Finally, a third component of the system (IRS 5N) was found in radio observations (Forbrich et al. 2006, 2007c). It is located 85 north-east of IRS 5a/b, a projected linear separation of ~1100 AU. Subsequent Spitzer and Submillimeter Array observations (Peterson et al. 2011) have confirmed the classification of the (unresolved) source IRS 5 as a class I protostar while providing a first classification of IRS 5N, also as a class I protostar. Interestingly, only IRS 5N and not IRS 5a/b is detected in millimeter continuum observations with the Submillimeter Array.
In the centimeter radio regime, the Coronet cluster was first observed by Brown (1987) who detected radio counterparts to most embedded infrared sources. A multi-epoch radio study of the cluster by Suters et al. (1996) found that the radio flux density of IRS 5 is variable by a factor of 5 on timescales of weeks, pointing to possible non-thermal emission. Subsequently, Feigelson et al. (1998) showed that among the radio counterparts in this cluster, IRS 5 stands out because it shows circular polarization, a clear sign of non-thermal emission. As such, CrA IRS 5 has remained one of only very few comparable protostars with clear signs of non-thermal emission. Its non-thermal nature was confirmed by subsequent studies (Forbrich et al. 2006, 2007c; Miettinen et al. 2008). In the deep X-ray study of Forbrich & Preibisch (2007), IRS 5 appears as a marginally resolved source which could be resolved into two counterparts (Forbrich et al. 2007b). It has since been shown that IRS 5a and 5b have both X-ray and radio counterparts (Hamaguchi et al. 2008; Choi et al. 2008). In a polarimetric study of the region, Choi et al. (2009) have shown that the non-thermal emission of IRS 5 is entirely due to component IRS 5b, the northeastern source. Since the early classification of the IRS 5 system as a class I protostar still holds when incorporating Spitzer data (Peterson et al. 2011), it is still worth pointing out that, intriguingly, CrA IRS 5 is essentially the only known class I protostar with clearly non-thermal radio emission. The fact that it is a close binary may offer an explanation since this may help clearing the line of sight of ionized material.
2. Observations and data reduction
We observed the Coronet region with the Long Baseline Array (LBA) on 3 occasions – March 2010, October 2010 and April 2012 (LBA project code v329). The initial goal of these observations was an astrometric campaign to determine the distance to the Coronet region, and accordingly several non-thermal sources thought likely to be compact (IRS 5 and IRS 7) were targeted in the first two epochs. Initial positions for IRS 5 and IRS 7 were taken from Chandra observations (Forbrich & Preibisch 2007). In the third epoch, only IRS 5 was targeted, for reasons explained below.
In each epoch, continuum observations at 8.4 GHz (3.6 cm) were made using all available antennas of the LBA. In all 3 epochs, the Australia Telescope National Facility (ATNF) observatories at Parkes (64-m single dish), the Australia Telescope Compact Array (ATCA; five 22-m antennas phased), and Mopra (22-m single dish), were available, as were the Hobart (26-m single dish) and Ceduna (30-m single dish) antennas operated by the University of Tasmania. For the final observation, the 12-m antenna at Warkworth in New Zealand operated by Auckland University of Technology was also used. In each case, the observation duration was 10 h. Two dual–polarization bands of width 16 MHz were sampled with two bit precision in the frequency ranges 8.409–8.425 GHz and 8.425–8.441 GHz in all observations. For the final observation, additional bands spanning 8.441–8.457 GHz and 8.457–8.473 GHz were utilized at the three ATNF stations only (making use of an additional digital backend available at these stations). The data were correlated at Curtin University using the DiFX software correlator (Deller et al. 2011) in full polarization mode (correlating both the parallel–hand and cross–hand products).
The target sources were phase referenced using a calibrator separated by 2° (J1853–3628). Additionally, a bright fringe finder (1718–649 or 1921–293) was observed for 5 min before and after every ~4-h block on the target field. For the first two epochs, a cycle time of 6 min was used, in which 2 min was spent on the calibrator and two minutes on each target source; the predicted 1σ image rms for each target field using natural weighting was 63 μJy beam-1. For the final epoch, the cycle time was reduced to 4.25 min, of which 3 min was spent on the target and 1.25 min on the calibrator. Along with the extra bandwidth, this extra time on a single target field almost doubled the final sensitivity, with a predicted 1σ rms of 33 μJy beam-1.
Data reduction was performed using the AIPS1 software package, and imaging was performed using Difmap (Shepherd 1997). The data were amplitude calibrated using system temperature data (logged from the station where available, otherwise a priori values used), followed by delay calibration using the phase reference source. Phase and amplitude calibration were then performed using a model of J1853–3628 derived from these observations. The absolute amplitude calibration of the data is expected to be correct at the 20% level – the low accuracy being due to the limited system temperature logging. Instrumental polarization was not corrected, as these observations were not intended for high–accuracy polarimetry and did not include scans on a suitable polarization calibrator. Polarization leakage at the LBA antennas may be as severe as 20%, although it is likely much lower (Dodson 2008).
After calibration, we searched for emission over a wide area for each target field using IMAGR in AIPS with 4096 × 4096 pixels of size 0.75 milliarcseconds (mas) to cover an area of radius  . Fields were imaged at the position of IRS 5a/b, IRS 5N and IRS 7. For IRS 5a/b, the only field in which a detection was made, the data were corrected to re-center the image on the detection, split, averaged in frequency and exported from AIPS in uvfits format for imaging in Difmap. In Difmap, 512 × 512 pixel images with a pixel size of 0.5 mas were formed using natural weighting for all three epochs.
3. Results
Figure 1 shows the final IRS 5a/b images from difmap for all three epochs in Stokes I. There is a clear (11σ) detection in the final epoch with a peak flux density of 330 μJy beam-1 at a position of 19h01m48 07899 −36°57′221743. A tentative detection (5.4σ, discussed further below) with a peak flux density of 350 μJy beam-1 is made in the first epoch at a position of 19h01m4807778 −36°57′221150, while no detection is made in the second epoch (5σ upper limit of 375 μJy beam-1). As shown in Fig. 2 and discussed further below, the source we detect in our LBA images is much closer to IRS 5b than IRS 5a. Coupled with the previous work summarized in the introduction which identified IRS 5b as a non-thermal source, this positional coincidence allows us to conclude that we have detected IRS 5b, and that IRS 5a was not detected in any epochs.
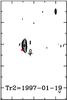 |
Fig. 2 Highest-resolution (frequency 8.5 GHz, synthesized beam 0 |

For the clear detection of IRS 5b in the final epoch, the angular resolution is 5.1 mas × 11.0 mas, at a position angle of −816. A single Gaussian component was fit to the source using the AIPS task JMFIT – the fitted deconvolved size is 9.8 × 5.0 mas at a position angle of 85°, with an integrated intensity of 575 μJy. This corresponds to a physical size of 1.3 × 0.7 AU at the distance of IRS 5. However, this fit is likely an upper limit to the source size, as residual phase errors (no self-calibration was possible due to the low flux density) are likely to broaden the image somewhat. No significant signal is seen in Stokes V; the level of polarization (≲20%; Feigelson et al. 1998) seen in earlier observations would make such a detection unlikely given our noise level of 28 μJy beam-1 in Stokes V and the substantial instrumental polarization leakage.
We also searched for emission from IRS 5N, using the nominal VLA position from Forbrich et al. (2006). In the final, most sensitive observation, the rms noise level in our LBA images at this position is 28 μJy beam-1, similar to the level reached at the position of IRS 5a/b. No potential sources are seen above 5σ within of the nominal position, and so we can constrain the peak flux density of the IRS 5N source to be <140 μJy beam-1 at VLBI scales for this epoch.
Our other target in the Coronet cluster, the IRS 7 region, also remained undetected in the two epochs it was targeted, with a 5σ upper limit of ~350 μJy. While neither Suters et al. (1996) nor Forbrich et al. (2006, 2007c) had previously found unambiguous signs of non-thermal emission toward protostars in this region, Miettinen et al. (2008) reported the tentative detection of gyrosynchrotron radiation from outflow lobes in this area and Choi et al. (2009) reported the detection of a low degree of circular polarization of IRS 7A in one out of 13 epochs of VLA data analyzed. Our non-detection could thus be due to variability.
4. Discussion
The detection obtained here with the LBA of IRS 5b is the first firm VLBI detection of a well-established class I protostar. Even though both components of this binary were detected in radio emission in earlier observations with lower angular resolution (using the VLA), we only detect one component, IRS 5b. We note that the nearby component IRS 5N also remains undetected. Based on the peak flux density seen in our VLBI observations, we can derive a lower limit of >1.4 × 10⁵ K for the brightness temperature of IRS 5b. This lower limit is too low to rule out thermal emission by itself and thus does not provide a clear signature of non-thermal emission. Such a signature was, however, provided earlier with multiple reported detections of circularly polarized emission from this source (see above). The flux density at which the source is detected is compatible with the quiescent flux densities found by Forbrich et al. (2006) and Choi et al. (2008). These observations constrain the size of the emission region to less than 1 AU at the distance of CrA, by far the best constraint provided by direct imaging to date. However, this is still much larger than the presumed size of this low-mass star, and the non-thermal emission is most likely due to coronal activity which extends at most out to a small number of stellar radii.
As noted above, we consider the 5.4σ peak in the Stokes I image of IRS 5 from the first epoch observation to be a tentative detection, an interpretation which is strengthened by the proper motion which it implies. In addition to the two position measurements of IRS 5b from our first and third observing epochs, we can make use of Very Large Array (VLA) observations presented by Choi et al. (2008) to greatly extend the time baseline of these radio observations and check for consistency. We use the reference position for IRS 5b from the observation Tr 1 in Choi et al. (2008), which offers the longest time baseline and the highest angular resolution (VLA A-array observations made in 1996 at a wavelength of 3.5 cm). With these three points, we are able to fit for a radio proper motion, which we find to be μαcosδ = 6.9 ± 0.3 mas yr-1, μδ = −27.3 ± 0.1 mas yr-1. This fit is dominated by the two LBA positions, since the error bars are much smaller, but the fit is consistent with all 3 epochs. Furthermore, it closely matches the value of (μαcosδ, μδ) = (5.5, −27.0) mas yr-1 obtained for the mean proper motion of CrA members by Neuhäuser et al. (2000). To perform this fit, the parallax was fixed to 7.7 mas, representing a distance of 130 pc. The positions and fitted motion of IRS 5b are shown in Fig. 3. We note that Choi et al. (2008) were unable to determine a significant proper motion from VLA observations of IRS 5b alone, but the LBA observations added here extend the time baseline and have a resolution and positional accuracy more than an order of magnitude higher.
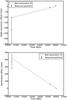 |
Fig. 3 Proper motion of IRS 5b fitted from the two LBA detections and one VLA position taken from Choi et al. (2008). The parallax has been fixed based on the assumed distance of 130 pc, but the proper motion results are insensitive to small variations in this parameter. |
The nominal positional accuracy of our significant VLBI detection in the third observing epoch (as reported by the AIPS task JMFIT) is 0.6 mas in right ascension and 0.3 mas in declination. Given that the separation to the primary calibrator is 2°, systematic astrometric errors for LBA observations are unlikely to exceed this level (Deller et al. 2008, 2012). With 4 such epochs, it should be possible to measure the parallax and proper motion of IRS 5b at the level of 0.2 mas and 0.2 mas yr-1 respectively, sufficient to obtain the distance to the source with an accuracy of only a few pc. However, obtaining this result will require significant additional observing resources, as a full observing track at each epoch is required to obtain even a low–significance detection, and the effect of variability is still uncertain, since we have only one firm detection. Over the relevant observing timescale (several years) the binary orbital motion would be negligible, since the binary separation is >100 AU (Choi et al. 2008).
5. Summary
This first VLBI detection of a class I protostar underlines the peculiar nature of CrA IRS 5. Compared to previous detections, IRS 5b shows a relatively low radio flux density in our detections. Future observations, if coinciding with a more active state of the system (like that seen by Choi et al. 2008) would place considerably more stringent constraints on the nature of the emission. Furthermore, our detection shows the potential for VLBI observations of these sources to determine accurate parallax and proper motion measurements in an absolute reference frame. Our preliminary results already indicate that the proper motion of IRS 5b is similar to that of other members of the Coronet cluster. The currently best distance determination of CrA is based on a full orbit solution of the double-lined spectroscopic binary TY CrA (Casey et al. 1998), yielding a distance of 128 ± 11 pc. However, that source is not located directly in the Coronet cluster, and in the past, distances of up to 170 pc have been estimated for CrA. Our LBA measurements demonstrate that distance determinations to star-forming regions, based on parallax measurements using continuum emission from YSOs (e.g., Menten et al. 2007; Loinard et al. 2007b; Dzib et al. 2010) is also possible at southern declinations that are not accessible with the NRAO VLBA. Given the low detection rate of non-thermal emission in protostars, our observations also show the importance of carefully selecting suitable VLBI targets from preceding measurements at lower angular resolution.
Acknowledgments
The Long Baseline Array is part of the Australia Telescope National Facility which is funded by the Commonwealth of Australia for operation as a National Facility managed by CSIRO. A.T.D. was supported by an NWO Veni Fellowship. This publication is supported by the Austrian Science Fund (FWF). L.L. acknowledges the financial support of DGAPA, UNAM, CONACyT (México), and the Alexander von Humboldt Stiftung.
References
- André, P. 1987, in Protostars and Molecular Clouds, eds. T. Montmerle, & C. Bertout, 143 [Google Scholar]
- André, P. 1996, in Radio Emission from the Stars and the Sun, eds. A. R. Taylor, & J. M. Paredes, ASP Conf. Ser., 93, 273 [Google Scholar]
- André, P., Ward-Thompson, D., & Barsony, M. 1993, ApJ, 406, 122 [NASA ADS] [CrossRef] [Google Scholar]
- Brown, A. 1987, ApJ, 322, L31 [NASA ADS] [CrossRef] [Google Scholar]
- Casey, B. W., Mathieu, R. D., Vaz, L. P. R., Andersen, J., & Suntzeff, N. B. 1998, AJ, 115, 1617 [NASA ADS] [CrossRef] [Google Scholar]
- Chen, W. P., & Graham, J. A. 1993, ApJ, 409, 319 [NASA ADS] [CrossRef] [Google Scholar]
- Choi, M., Hamaguchi, K., Lee, J.-E., & Tatematsu, K. 2008, ApJ, 687, 406 [NASA ADS] [CrossRef] [Google Scholar]
- Choi, M., Tatematsu, K., Hamaguchi, K., & Lee, J.-E. 2009, ApJ, 690, 1901 [NASA ADS] [CrossRef] [Google Scholar]
- Deller, A. T., Verbiest, J. P. W., Tingay, S. J., & Bailes, M. 2008, ApJ, 685, L67 [NASA ADS] [CrossRef] [Google Scholar]
- Deller, A. T., Brisken, W. F., Phillips, C. J., et al. 2011, PASP, 123, 275 [NASA ADS] [CrossRef] [Google Scholar]
- Deller, A. T., Camilo, F., Reynolds, J. E., & Halpern, J. P. 2012, ApJ, 748, L1 [NASA ADS] [CrossRef] [Google Scholar]
- Dodson, R. 2008, A&A, 480, 767 [NASA ADS] [CrossRef] [EDP Sciences] [Google Scholar]
- Duchêne, G., Ghez, A. M., McCabe, C., & Ceccarelli, C. 2005, ApJ, 628, 832 [NASA ADS] [CrossRef] [Google Scholar]
- Dzib, S., Loinard, L., Mioduszewski, A. J., et al. 2010, ApJ, 718, 610 [NASA ADS] [CrossRef] [Google Scholar]
- Feigelson, E. D., Carkner, L., & Wilking, B. A. 1998, ApJ, 494, L215 [NASA ADS] [CrossRef] [Google Scholar]
- Forbrich, J., & Preibisch, T. 2007, A&A, 475, 959 [NASA ADS] [CrossRef] [EDP Sciences] [Google Scholar]
- Forbrich, J., Preibisch, T., & Menten, K. M. 2006, A&A, 446, 155 [NASA ADS] [CrossRef] [EDP Sciences] [Google Scholar]
- Forbrich, J., Massi, M., Ros, E., Brunthaler, A., & Menten, K. M. 2007a, A&A, 469, 985 [NASA ADS] [CrossRef] [EDP Sciences] [Google Scholar]
- Forbrich, J., Preibisch, T., & Menten, K. M. 2007b, Mem. Soc. Astron. Italiana, 78, 301 [NASA ADS] [Google Scholar]
- Forbrich, J., Preibisch, T., Menten, K. M., et al. 2007c, A&A, 464, 1003 [NASA ADS] [CrossRef] [EDP Sciences] [Google Scholar]
- Güdel, M. 2002, ARA&A, 40, 217 [NASA ADS] [CrossRef] [Google Scholar]
- Hamaguchi, K., Choi, M., Corcoran, M. F., et al. 2008, ApJ, 687, 425 [NASA ADS] [CrossRef] [Google Scholar]
- Johnston, K. J., Fey, A. L., Gaume, R. A., et al. 2004, ApJ, 604, L65 [NASA ADS] [CrossRef] [Google Scholar]
- Lada, C. J. 1987, in Star Forming Regions, eds. M. Peimbert, & J. Jugaku, IAU Symp., 115, 1 [Google Scholar]
- Loinard, L., Rodríguez, L. F., D’Alessio, P., Rodríguez, M. I., & González, R. F. 2007a, ApJ, 657, 916 [NASA ADS] [CrossRef] [Google Scholar]
- Loinard, L., Torres, R. M., Mioduszewski, A. J., et al. 2007b, ApJ, 671, 546 [NASA ADS] [CrossRef] [Google Scholar]
- Menten, K. M., Reid, M. J., Forbrich, J., & Brunthaler, A. 2007, A&A, 474, 515 [NASA ADS] [CrossRef] [EDP Sciences] [Google Scholar]
- Miettinen, O., Kontinen, S., Harju, J., & Higdon, J. L. 2008, A&A, 486, 799 [NASA ADS] [CrossRef] [EDP Sciences] [Google Scholar]
- Neuhäuser, R., & Forbrich, J. 2008, in The Corona Australis Star Forming Region, ed. B. Reipurth, 735 [Google Scholar]
- Neuhäuser, R., Walter, F. M., Covino, E., et al. 2000, A&AS, 146, 323 [NASA ADS] [CrossRef] [EDP Sciences] [Google Scholar]
- Nisini, B., Antoniucci, S., Giannini, T., & Lorenzetti, D. 2005, A&A, 429, 543 [NASA ADS] [CrossRef] [EDP Sciences] [Google Scholar]
- Peterson, D. E., Caratti o Garatti, A., Bourke, T. L., et al. 2011, ApJS, 194, 43 [NASA ADS] [CrossRef] [Google Scholar]
- Phillips, R. B., Lonsdale, C. J., & Feigelson, E. D. 1993, ApJ, 403, L43 [NASA ADS] [CrossRef] [Google Scholar]
- Phillips, R. B., Lonsdale, C. J., Feigelson, E. D., & Deeney, B. D. 1996, AJ, 111, 918 [NASA ADS] [CrossRef] [Google Scholar]
- Preibisch, T. 1999, A&A, 345, 583 [NASA ADS] [Google Scholar]
- Shepherd, M. C. 1997, in Astronomical Data Analysis Software and Systems VI, eds. G. Hunt, & H. Payne, ASP Conf. Ser., 125, 77 [Google Scholar]
- Smith, K., Pestalozzi, M., Güdel, M., Conway, J., & Benz, A. O. 2003, A&A, 406, 957 [NASA ADS] [CrossRef] [EDP Sciences] [Google Scholar]
- Suters, M., Stewart, R. T., Brown, A., & Zealey, W. 1996, AJ, 111, 320 [NASA ADS] [CrossRef] [Google Scholar]
- Taylor, K. N. R., & Storey, J. W. V. 1984, MNRAS, 209, 5 [Google Scholar]
- White, S. M., Pallavicini, R., & Kundu, M. R. 1992, A&A, 259, 149 [NASA ADS] [Google Scholar]
All Figures
|
Fig. 1 Naturally weighted 3.6 cm LBA images of CrA IRS 5 at the three observed epochs. The synthesized beam is shown in the lower left corner of each image. The contours show −3, +3, 5, 7, 9, and 11σ, where σ is the noise level in each image (65, 75, and 27 μJy in the three images, respectively.) The scale bar in AU assumes a distance of 130 pc. |
| In the text | |
|
Fig. 2 Highest-resolution (frequency 8.5 GHz, synthesized beam 0 |
| In the text | |
|
Fig. 3 Proper motion of IRS 5b fitted from the two LBA detections and one VLA position taken from Choi et al. (2008). The parallax has been fixed based on the assumed distance of 130 pc, but the proper motion results are insensitive to small variations in this parameter. |
| In the text | |
Current usage metrics show cumulative count of Article Views (full-text article views including HTML views, PDF and ePub downloads, according to the available data) and Abstracts Views on Vision4Press platform.
Data correspond to usage on the plateform after 2015. The current usage metrics is available 48-96 hours after online publication and is updated daily on week days.
Initial download of the metrics may take a while.