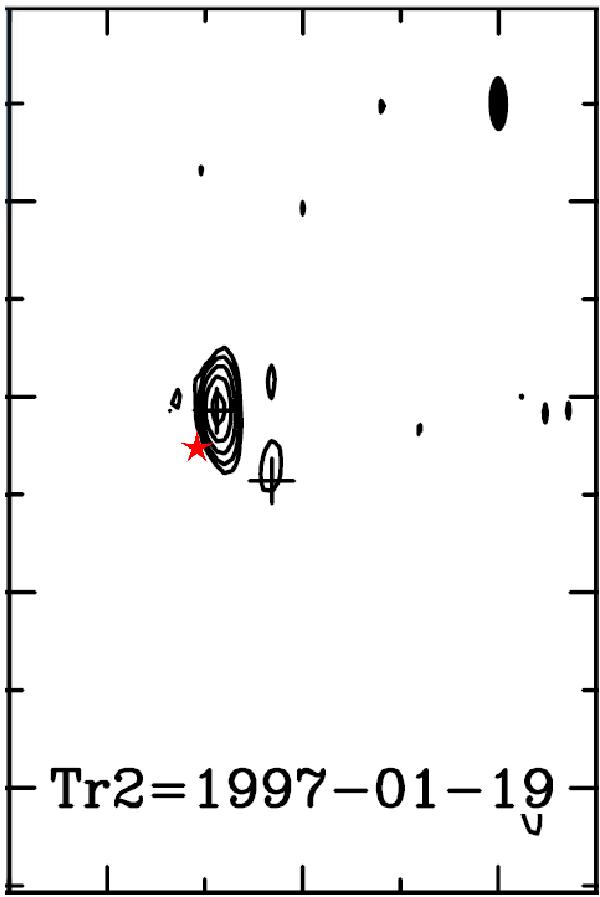
Fig. 2
Highest-resolution (frequency 8.5 GHz, synthesized beam 0
 31) VLA image from Fig. 12 in Choi et al. (2008). The tickmarks are spaced at 1′′ intervals, corresponding to 130 pc. The position of the source that we detect in the third epoch of our LBA observations is marked by a red star. We interpret the detection as a counterpart of IRS 5b since IRS 5a is more than twice as distant. This conclusion is further strengthened when the effects of proper motion are considered.
Current usage metrics show cumulative count of Article Views (full-text article views including HTML views, PDF and ePub downloads, according to the available data) and Abstracts Views on Vision4Press platform.
Data correspond to usage on the plateform after 2015. The current usage metrics is available 48-96 hours after online publication and is updated daily on week days.
Initial download of the metrics may take a while.