Fig. 8
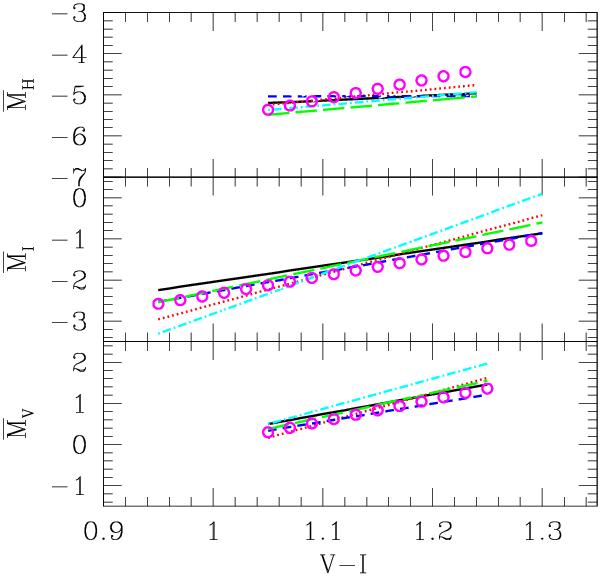
V, I and HF160W-band SBF versus (V − I) predictions from five independent stellar population synthesis codes: solid line (black), dotted line (red), dashed line (blue), long-dashed line (green), dot-dashed (cyan) line show the updated SPoT, Blakeslee et al. (2001), Liu et al. (2002), Marín-Franch & Aparicio (2006), and González-Lópezlira et al. (2010) best fit lines, respectively. Empty (magenta) circles show the corresponding empirical relations, also given in Table 5. (See electronic version of the Journal for a colour version of the figure.)
Current usage metrics show cumulative count of Article Views (full-text article views including HTML views, PDF and ePub downloads, according to the available data) and Abstracts Views on Vision4Press platform.
Data correspond to usage on the plateform after 2015. The current usage metrics is available 48-96 hours after online publication and is updated daily on week days.
Initial download of the metrics may take a while.