| Issue |
A&A
Volume 552, April 2013
|
|
|---|---|---|
| Article Number | A106 | |
| Number of page(s) | 22 | |
| Section | Extragalactic astronomy | |
| DOI | https://doi.org/10.1051/0004-6361/201220756 | |
| Published online | 10 April 2013 | |
Online material
Appendix A: Some musings on PNLF and SBF distances
One of the most intriguing issues in the extragalactic distance scale is the ~+0.3 mag average offset between the PNLF and SBF distance moduli (Ciardullo 2012). Locally, there appears to be very little offset, but the discrepancy increases with distance, such that the PNLF method gives smaller mean distances for the Virgo and Fornax clusters, as well as a smaller relative distance of Fornax with respect to Virgo (see Villegas et al. 2010). Consistently, Feldmeier et al. (2007) found that the value of H0 obtained from SNe Ia was 10% higher when the SN Ia distances were calibrated via PNLF distances, as compared to the H0 obtained by calibrating the SN Ia distances by either SBF or directly from Cepheid distances.
As discussed in detail in Sects. 4 and 5, to reliably compare two or more distance indicators, it is of paramount importance to verify the consistency of the calibrations (or calibrators) used. Both PNLF and SBF calibrations are tied to the same primary indicator, the period-luminosity relation of Cepheids, and to the same dataset, i.e., the Cepheids from Freedman et al. (2001). However, the zero points of present SBF calibrations are tied to the Cepheid distances obtained with metallicity-dependent PL relations (DPLZ hereafter; Mei et al. 2007; Blakeslee et al. 2009, 2010, this paper), while the standard PNLF calibration relies on Cepheid distances with no dependence on metallicity (DPL; Ciardullo et al. 2002; Feldmeier et al. 2007; Ciardullo 2012).
In this appendix, we take the detailed discussion presented in Ciardullo et al. (2002) – who found the ~0.3 mag mismatch between the two distance indicators – and analyze the correction terms needed to homogenize the comparison.
First, as discussed above, Tonry et al. (2001) distance moduli should be revised downward by 0.06 mag when using the DPLZ. For PNLF, instead, Ciardullo (2012) reported a +0.07 mag correction to the PNLF distance moduli (0.07 mag brighter zeropoint, M∗) when the DPLZdistances are used instead of DPL. It is useful to note that the author also finds that the best-fit value to M∗ calibrated against the RGB-Tip distances, i.e., independently from Cepheid distances, is again +0.07 mag brighter than the PNLF calibration obtained from DPL.
The two corrections: a) −0.06 mag for SBF distances, and b) +0.07 mag for PNLF, both deriving from the adoption of the DPLZ, can justify ~0.13 mag of the PNLF-SBF offset.
SBF to PNLF comparison.
Figure A.1 shows the histogram of the differences between PNLF and SBF distance moduli based on various SBF and PNLF distance and/or calibration. Panel a) in the figure shows the PNLF to SBF difference, ΔPNLF − SBF, using the original sample of 28 galaxies by Ciardullo et al. (2002), with updated zero points for both distance indicators. The mean is ΔPNLF − SBF = −0.23 mag, to be compared to ΔPNLF − SBF = −0.36 mag before zero-point correction.
After the Ciardullo et al. (2002) paper, few PNLF distances have been obtained for galaxies with SBF measurements. Panel b) in Fig. A.1 shows the PNLF to SBF difference for a total of 33 galaxies, including the distances obtained after 2002. The comparison shown in panel c) is obtained using the recent SBF distances from the ACSVCS and ACSFCS surveys (when available) in place of the Tonry et al. (2001) distances. Finally, panel d) uses the same SBF and PNLF distances of panel c) except that for the galaxies with old Tonry et al. (2001) corrected distances we include the further “Q-correction” term using Eq. (A.1) from Blakeslee et al. (2010). Table A.1 presents the average and median differences for all assumptions shown in Fig. A.1.
It is worth mentioning that, according to Ciardullo et al. (2002), to properly compare PNLF and SBF, the latter distance moduli should be further reduced by 0.04 mag. If one includes this correction term, all differences reported in Table A.1 becomes smaller, with the best sample (i.e., d in the table) providing ΔPNLF − SBF = −0.14 ± 0.06 mag, and a median of − 0.22 mag.
Taking into account all the corrections described above, the offset between SBF and PNLF distances is reduced to half of the original estimate, once the proper calibrations and recent/updated distances are used for both indicators. However, even in the best case there is a non-negligible ≲0.2 mag offset between SBF and PNLF that implies ~10% larger SBF distances. Again, this difference occurs mainly beyond ~10 Mpc, and is similar to the 10% larger H0 obtained when calibrating SNe Ia via PNLF instead of Cepheids (Feldmeier et al. 2007).
Even though the data presented in Table A.1 (with the possible further +0.04 mag improvement cited above) suggest that the best average difference is statistically consistent with zero – especially taking into account the systematic uncertainties, not considered in this comparison – the scatter we find is larger, or nearly equal to the squared sum of the estimated internal scatters of both indicators. Taken at face value, this result either means that the internal scatter of one or both indicators is underestimated, or that a real systematic offset exists between the two.
As another test, to further check the latter concern, we analyzed the PNLF to SBF offset by considering late-type and early-type galaxies separately. Using sample d in Table A.1, we find the following differences:  mag (median − 0.30 mag) based on the data of 24 galaxies, and
  mag (median − 0.02 mag) for the remaining 9 galaxies. The result shows that for the class of galaxies used to derive SBF and PNLF zero points, i.e., the late types hosting Cepheids, there is no statistically significant offset between the two indicators. On the other hand, for early-type galaxies the offset is large, and statistically inconsistent with zero. Related to this, one fundamental difference between the two indicators is that absolute SBF magnitudes are “corrected” for galaxy stellar content, i.e., the difference between early- and late-type galaxies is taken into account with SBF, while the PNLF distances are based on the constancy of M∗ for both types of galaxy.
The calibration of SBF magnitudes, and its dependence on galaxy type, has been analyzed in detail over a ground-based sample of ~300 galaxies by Tonry et al. (2001), and more recently from HST data of ~150 galaxies by Blakeslee et al. (2009, 2010). The derived SBF calibrations, as is well-known, include a colour-dependent term, which, as also shown by SSP models (Worthey 1993b; Cantiello et al. 2003; Raimondo et al. 2005), is basically a metallicity correction term. In optical bands, this correction term implies fainter SBF magnitudes for redder/more metal-rich systems.
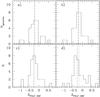 |
Fig. A.1
Histograms of the difference between PNLF and SBF distance moduli. Each panel shows different comparison/calibration samples. Panel a) original sample of 28 galaxies with PNLF and SBF distances from Ciardullo et al. (2002) and Tonry et al. (2001) respectively, with revised Cepheids calibration. Dotted/dashed vertical lines show the mean/median of the difference. Panel b) as in a) but 5 more galaxies with PNLF measurements made after Ciardullo et al. (2002) are added to the sample. Panel c) as b), but more recent ACSFCS and ACSVCS SBF distances are used when available. Panel d) as c), but the correction from Eq. (A.1) by Blakeslee et al. (2010) is included to Tonry et al. (2001) distances. |
| Open with DEXTER | |
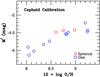 |
Fig. A.2
Figure 5 from Ciardullo (2012) showing the sole data with metallicity corrected Cepheids distances. (See electronic version of the Journal for a colour version of the figure.) |
| Open with DEXTER | |
In contrast, the M∗ calibration to PNLF does not include any metallicity dependent term for bright galaxies. A dependence of the PNLF M∗ to metallicity has been found by Ciardullo et al. (2002) and Ciardullo (2012), however the authors conclude that such dependence is relevant only in small, metal-poor systems.
Inspecting the open circles in Fig. 5 of Ciardullo (2012, open circles mark the data obtained from DPLZ, reported in Fig. A.2, one can see that a) the trend of M∗ with metallicity has the opposite sign with respect to SBF, meaning that M∗ gets brighter for more metal-rich systems, and that b) some residual correlation of M∗ with metallicity also appears in the high metallicity regime.
This strongly suggests that there may be some unaccounted for residual dependence of the PNLF calibration on the metallicity, presently unquantified because of the relatively limited sample – though detectable even in present datasets (Fig. A.2). If so, one possible explanation for the irreducible ~–0.2 mag offset between PNLF and SBF is that it may be due to a bias introduced by data from early-type galaxies, which are intrinsically on average more massive and more metal-rich than late types and, therefore, would typically have larger distances with respect to the current metallicity-independent calibration of the PNLF method.
Appendix B: Some notes on Type Ia SNe distances from Stritzinger et al. (2010)
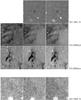 |
Fig. B.1
Zoom in 6 × 6 arcsec2 of the residual frames centered on the positions of the four SNe Ia, as labeled. Black circles mark the position of the respective SNa. UVIS/F336W, ACS/F435W and ACS/F555W frames (left, middle and right panels, respectively) are shown for the SN 1981D, SN 2006dd and SN 2006dd. The panels showing SN 1980N are g, r, and i observations taken from the Gemini Telescope archive. |
| Open with DEXTER | |
To understand the possible causes of the difference between our and Str10 distance we must recall that, as for SBF, in order to calibrate SNe Ia light curves one must rely on sources at known distance and/or with well-known intrinsic properties, and then standardize the absolute magnitude of the SN Ia (e.g., Phillips 1993).
Str10 derives the distance to NGC 1316 using three different methods: the EBV, the Tripp method, and the near-IR light-curves. The authors also use the MLCS2k2 method on SN 2006mr, obtaining a distance that is 50% further than the average they derived from the normal events.
In the following we discuss each one of the three methods used by Str10, trying to highlight the possible causes leading to the observed difference.
Appendix B.1: The colour excess method
Str10 adopted the calibration from Burns et al. (2011, AJ in press at the time Str10 was published) to obtain the distance moduli with the “EBV” model in their fitting package SNooPy. For this model they adopt the recommended calibration from Burns et al. (2011), which uses a sub-sample of unreddened SNe Ia from Folatelli et al. (2010), excluding fast declining objects, as SN 2006mr. Folatelli et al. (2010), in turn, calibrate their dataset using 26 SNe Ia at z > 0.01, whose distances are based on Hubble’s law assuming H0 = 72 km s-1 Mpc-1, and three SNe Ia at z < 0.01 with direct distance measurements. The three nearest objects include SN 2006mr, whose host’s distance is assumed (m − M) = 31.59 ± 0.08 mag from the SBF measurements by Cantiello et al. (2007a).
The SNooPy/EBV method relies (also) on an estimate of the internal reddening around the SN Ia. Str10 find that all four SNe Ia in NGC 1316 have negligible internal extinction. The authors warn about some complications in the interpretation of the data. With respect to spectroscopic analysis of Na I D absorption in the spectra of SN 2006dd and SN 2006mr, these authors state that “the very strong Na I D absorption observed in SNe Ia 2006dd and SN 2006mr is totally inconsistent with the low host galaxy reddening we derive from the light curve observations” (Str10, Sect. 4), as the colour evolution of the two SNe Ia closely resembles that of unreddened SNe Ia. However, while there is a general observational agreement on higher color excess corresponding to higher Na I D equivalent width (EW), this correlation is tight in high-resolution spectra, but the scatter increases substantially at lower resolution (Blondin et al. 2009; Poznanski et al. 2011, 2012), with considerable confusion due to the blending of the Na I D doublet. For instance, using Fig. 5 in Blondin et al. (2009), at EW ~ 1.5 (similar to that obtained by Str10 for NGC 1316) E(B − V)host ranges from ~0.1 to ~1.5 mag. As a further complication, besides the possible line blending, the line profiles for both SNe show clear evidence for structure, interpreted by Str10 as evidence of the presence of two unresolved sodium components. Nevertheless, coupling the EW measurements from Str10 (their Table 10, obtained from the authors’ highest dispersion spectra), with Eqs. (7)–(8) from Poznanski et al. (2012), we obtain E(B − V)host > 0.45 and >0.1 mag for SN 2006dd and SN 2006mr, respectively (with mean values ~1.4 and ~0.6 mag).
Nearby galaxy sample used for near-IR calibration: original and revised distances.
Clearly, as also highlighted by Str10, the strong Na I D absorption associated with no internal reddening might also be indicative of a non-standard gas-to-dust ratio for Fornax A, which given the merger history of this galaxy does not seem unreasonable.
A 6″ × 6″ zoom of the regions around the four SNe Ia is shown in Fig. B.1. In the upper part of the figure we show the HST UVIS/F336W, ACS/F435W and ACS/F555W residual frames of the three SNe Ia located within the frames analyzed in this work (SN 1981D, SN 2006dd, SN 2006mr). For sake of completeness, we have obtained archival g, r, and i-band Gemini/GMOS-S data of the region around the SN 1980N, shown in the lower panels of Fig. B.1. As evidenced in the figure, there are undeniable patterns of dust near the position of the 2006 SNe Ia, though one cannot decide whether the SNe are behind, in front of, or within such dust lanes.
The comparison with previous estimates of internal extinction from the literature show that for SN 1980N and SN 1981D, Jha et al. (2007) find E(B − V)host values larger than Str10 (three times larger in the case of SN 1981D) but in agreement within uncertainties with the SNooPy fits. The agreement gets worse if the extinctions derived by Str10 from near-IR data are taken into account. Note, however, that Str10 corrected the optical and near-IR photometry for host galaxy contamination. Such a correction, although negligible for the case of SN 1980N, does not seem to be discussed by Jha et al.
For both the two most recent SNe Ia, 2006dd and 2006mr, Maoz & Mannucci (2008) estimate an internal extinction of ~0.08 mag. In the case of SN 2006dd, SNooPy provides E(B − V)host = 0.043 ± 0.008 mag; while, as mentioned above, SNooPy cannot be used for fitting the light-curves of the fast declining SN 2006mr.
In conclusion, the three SNe Ia used by Str10 to get the best estimate of (m − M) could be controversial in terms of internal extinction, affecting both the estimate of with the EBV method, and the associated uncertainties.
Appendix B.2: The Tripp method
The second method adopted by Str10 is based on the two-parameter model of Tripp (1998) which, differently from the EBV method, can also be applied to fast declining SNe Ia. The calibrating sample is again taken from Folatelli et al. (2010), and SN 2006mr is omitted in the re-computed calibration relations, to avoid circularity.
The distance to the three normal SNe Ia with this method is consistent with the estimates based on the SNooPy/EBV method. In contrast, the (m − M) obtained with the data of SN 2006mr is ~+0.5 mag larger than the average of the other three SNe Ia.
One interesting point to note is that if one uses a distance modulus of ~31.2 mag to NGC 1316, as derived by Str10 from the three normal SNe Ia, then the data-point of SN 2006mr placed in Fig. 16 of Folatelli et al. (2010) is more than +0.5 mag off the linear relation drawn by the authors, with a scatter to the relation much larger than the rms reported in the cited figure. Certainly, changing the distance modulus of one of the calibrating data-points in the Folatelli et al. sample implies changing the linear calibration relation shown in the cited figure, and possibly reduces the offset between data and fit. In any case, though, using (m − M) ~ 31.2 entails considerably increasing the scatter in the calibrating sample of the Canergie Supernova Project, with NGC 1316 being one of the nearest objects and also the host galaxy with the largest scatter.
Appendix B.3: The near-IR method
The last method used by Str10 is based on near-IR light-curves of SNe Ia, calibrated using Krisciunas et al. (2009) absolute near-IR peak magnitudes without NGC 1316 data. The Krisciunas et al. calibration of near-IR peak magnitudes adopts new observations of SNe Ia, and data previously published by the same team (Krisciunas et al. 2004a,b). For the nearby galaxies, the authors adopted distances based on either SBF or Cepheids. From a careful reading of the cited papers, we find that Krisciunas et al. (2004a) obtained the JHK calibration from 16 SNe Ia. For three nearby galaxies, NGC 1316, NGC 4526, and NGC 5128, the authors adopt the SBF distance from Ajhar et al. (2001, based on DPLZ, while for NGC 4536 and NGC 3368 the DPL distances from Cepheids is used. Both SBF and Cepehids distances are based on the same Freedman et al. (2001) calibrating sample.
Krisciunas et al. (2004b) extended the sample of SNe Ia with well-sampled near-IR light-curves to about 20 objects. The authors added two more supernova-host galaxies with SBF distances – NGC 4374 and NGC 3190 – to the previous list of nearby galaxies. However, in contrast with Krisciunas et al. (2004a), they adopted the Tonry et al. (2001) distance moduli, which are based on DPL; that is, they are 0.06 mag larger than the reported by Ajhar et al. (2001).
Finally, the most recent calibration of near-IR light-curves of SNe Ia by Krisciunas et al. (2009), used the distance moduli for nearby galaxies from the SBF survey by Tonry et al. (2001) with the revised Jensen et al. (2003) zero points (+0.16 mag with respect to Tonry et al. 2001). More specifically, in the new list of ~25 supernova-host galaxies, the authors added three new objects, NGC 936, NGC 1201 and NGC 1371, with SBF-based distances. In addition, Krisciunas et al. adopted a revised SBF distance to NGC 5128 from Jensen et al. (2003). However, the authors corrected the (m − M) by +0.16 mag, which is the difference between the Tonry et al. (2001) and Jensen et al. (2003) calibrations, and not by +0.10 mag, i.e., the difference between the Ajhar et al. (2001) and Jensen et al. (2003) calibrations.
Hence, the calibration of the absolute magnitudes in near-IR bands used by Str10 relies on a sample of ~25 SNe Ia, with nine nearby calibrators (after excluding NGC 1316) having distances based on non-homogeneous calibrations. In Table B.1 we summarize the distance moduli used by Krisciunas et al. to calibrate the maxima of SNe Ia light-curves, and the ones revised by us in order to be a) internally homogeneous, and b) consistent with the Cepheid distances used in this work. As shown in the table, the revised distance moduli are on average 0.06 mag larger than the ones used for the original SNe Ia near-IR calibration. If one simply takes the average of these numbers, adding a sample of 15 objects more (25 total SNe Ia minus the nine nearby objects and NGC 1316) where no shift has to be applied, the correction to the absolute magnitudes in Table 9 of Str10 is ~–0.02 mag (a correction that should be applied to the calibration by Krisciunas et al. 2009).
Although a +0.02 mag shift in Str10 distance moduli goes in the direction of reducing the mismatch between our and Str10 distances, the amplitude of the correction is negligible. However, it suggests that the uncertainties associated with the near-IR calibrations might be underestimated.
In conclusion, the analysis presented in this Appendix highlights two main issues: i) the homogeneity of the calibrators used; and ii) the estimate of internal extinctions for SNe Ia (although one should not forget that the quality of the SN 1980N and SN 1981D data is lower than others). While the first issue listed works in the direction of reducing the difference between our and Str10 distance moduli, both issues imply an increase of the present levels of statistical/systematic uncertainties on SNe Ia distances.
© ESO, 2013
Current usage metrics show cumulative count of Article Views (full-text article views including HTML views, PDF and ePub downloads, according to the available data) and Abstracts Views on Vision4Press platform.
Data correspond to usage on the plateform after 2015. The current usage metrics is available 48-96 hours after online publication and is updated daily on week days.
Initial download of the metrics may take a while.