Fig. 3
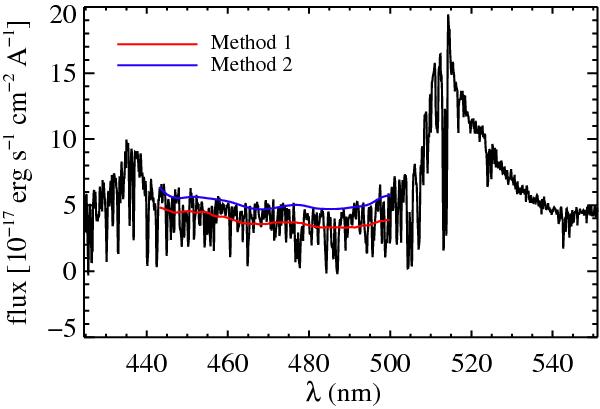
An example of a BOSS quasar spectrum of redshift 3.239. The red and blue lines cover the forest region used here, 104.5 < λrf < 118.0. This region is sandwiched between the quasar’s Lyβ and Lyα emission lines respectively at 435 and 515 nm. The blue line is an estimate of the continuum (unabsorbed flux) by method 2 and the red line is the estimate of the product of the continuum and the mean absorption by method 1.
Current usage metrics show cumulative count of Article Views (full-text article views including HTML views, PDF and ePub downloads, according to the available data) and Abstracts Views on Vision4Press platform.
Data correspond to usage on the plateform after 2015. The current usage metrics is available 48-96 hours after online publication and is updated daily on week days.
Initial download of the metrics may take a while.