Fig. A.1
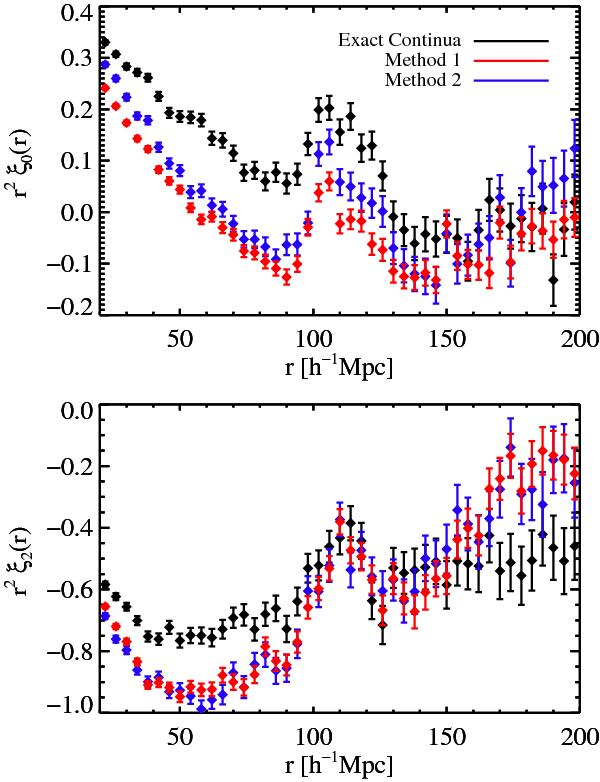
Effect of the continuum estimation procedure on the correlation function found with the mock spectra. The black dots are the average of monopole and quadrupole obtained with the 15 sets using the exact continua. The blue (red) dots show those obtained with the continuum estimation of method 1 (method 2) as described in Sect. 3.1 (3.2).
Current usage metrics show cumulative count of Article Views (full-text article views including HTML views, PDF and ePub downloads, according to the available data) and Abstracts Views on Vision4Press platform.
Data correspond to usage on the plateform after 2015. The current usage metrics is available 48-96 hours after online publication and is updated daily on week days.
Initial download of the metrics may take a while.