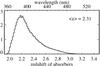
Fig. 2
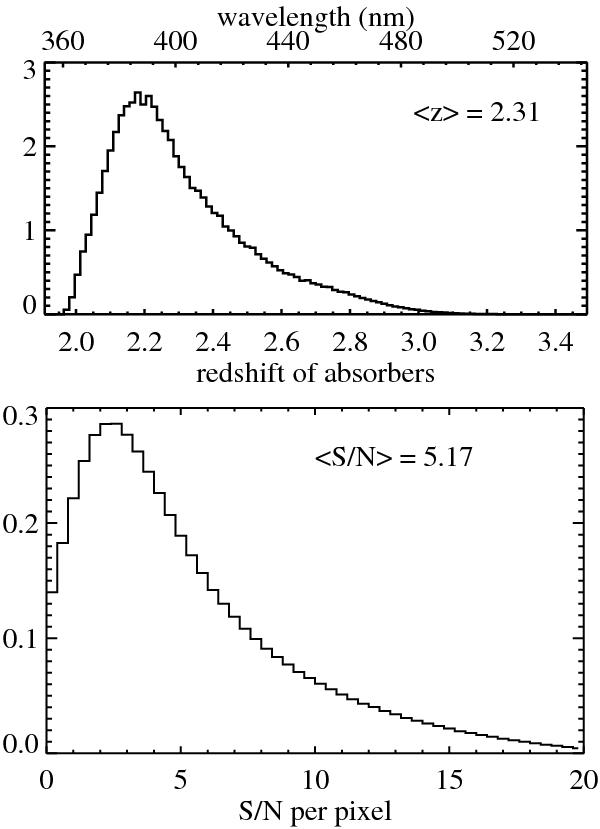
Top: weighted distribution of absorber redshifts used in the calculation of the correlation function in the distance range 80 h-1 Mpc < r < 120 h-1 Mpc. Bottom: distribution of signal-to-noise ratio for analysis pixels (triplets of pipeline pixels) averaged over the forest region.
Current usage metrics show cumulative count of Article Views (full-text article views including HTML views, PDF and ePub downloads, according to the available data) and Abstracts Views on Vision4Press platform.
Data correspond to usage on the plateform after 2015. The current usage metrics is available 48-96 hours after online publication and is updated daily on week days.
Initial download of the metrics may take a while.