Fig. 12
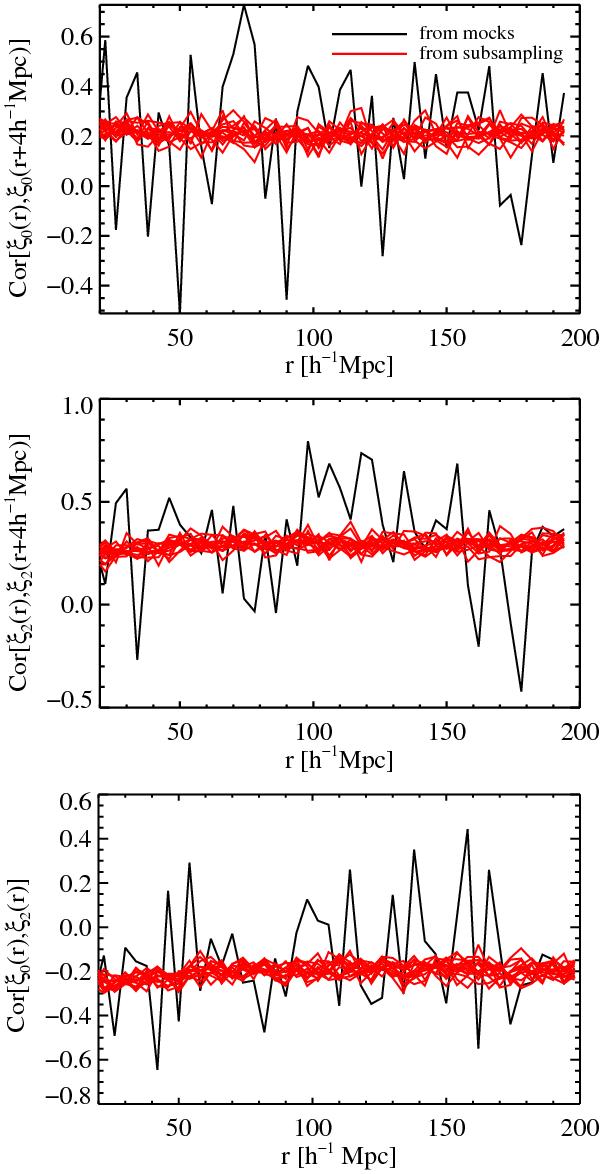
Verification of the off-diagonal elements of the covariance matrix with the 15 sets of mock spectra. The black lines show correlations derived from the dispersion of the 15 measurements and the red lines show the correlations expected from the covariance matrix calculated by sub-sampling. The top and middle panels show the correlation between neighboring bins for monopole and quadrupole respectively. The bottom panel, the correlation between monopole and quadrupole measured at the same distance bin.
Current usage metrics show cumulative count of Article Views (full-text article views including HTML views, PDF and ePub downloads, according to the available data) and Abstracts Views on Vision4Press platform.
Data correspond to usage on the plateform after 2015. The current usage metrics is available 48-96 hours after online publication and is updated daily on week days.
Initial download of the metrics may take a while.