| Issue |
A&A
Volume 552, April 2013
|
|
|---|---|---|
| Article Number | A84 | |
| Number of page(s) | 7 | |
| Section | The Sun | |
| DOI | https://doi.org/10.1051/0004-6361/201220693 | |
| Published online | 29 March 2013 | |
Consistent long-term variation in the hemispheric asymmetry of solar rotation
1
Department of PhysicsUniversity of Oulu,
90914
Oulu,
Finland
e-mail:
This email address is being protected from spambots. You need JavaScript enabled to view it.
2
Key Laboratory of Solar Activity, National Astronomical
Observatories, Chinese Academy of Sciences, 100012
Beijing, PR
China
3
Sodankylä Geophysical Observatory, University of Oulu,
99600
Tähtelä,
Finland
Received:
5
November
2012
Accepted:
26
February
2013
Abstract
Context. Solar active longitudes and their rotation have been studied for a long time using various forms of solar activity. However, the results on the long-term evolution of rotation rates and the hemispheric asymmetry obtained by earlier authors differ significantly from each other.
Aims. We aim to find a consistent result on the long-term migration of active longitudes of sunspots in 1877−2008 separately for the two hemispheres.
Methods. We used a dynamic, differentially rotating reference system to determine the best-fit values of the differential rotation parameters of active longitudes for each year in 1877−2008. With these parameters we determined the momentary rotation rates at the reference latitude of 17° and calculated the non-axisymmetries of active longitudes. We repeated this with five different fit intervals and two weighting methods and compared the results.
Results. The evolution of solar surface rotation in each hemisphere suggests a quasi-periodicity of about 80−90 years. The long-term variations of solar rotation in the northern and southern hemisphere have a close anti-correlation, leading to a significant 80−90-year quasi-periodicity in the north-south asymmetry of solar rotation. The north-south asymmetry of solar rotation is found to have an inverse relationship with the area of large sunspots. The latitudinal contrast of differential rotation is also found to be anti-correlated with the sunspot area. Different fit and weight methods yield similar results.
Conclusions. Our results give strong evidence for the anti-correlation of the rotation of the two solar hemispheres. The long-term oscillation of solar rotation suggests that a systematic interchange of angular momentum takes place between the two hemispheres at a period of about 80−90 years.
Key words: Sun: activity / Sun: rotation / sunspots
© ESO, 2013
1. Introduction
Solar surface rotation has been studied for a long time using various forms of solar activity, such as sunspots (Balthasar & Wöhl 1980; Pulkkinen & Tuominen 1998), magnetic fields (Sheeley et al. 1992; Brajša et al. 1992), coronal holes and coronal magnetic fields (Nash et al. 1988; Wang et al. 1988), filaments (Brajša et al. 1997), and faculae (Meunier et al. 1997). The secular deceleration of solar rotation was suggested by Brajša et al. (2006) and Li et al. (2011), while a secular acceleration trend was found by Heristchi & Mouradian (2009). A north-south asymmetry in solar rotation has been reported by many authors (Howard et al. 1984; Gilman & Howard 1984; Balthasar et al. 1986; Antonucci et al. 1990; Rybák 1994, 2000; Brajša et al. 1997, 2000; Javaraiah 2003; Georgieva et al. 2005; Mursula & Hiltula 2004; Gigolashvili et al. 2007; Zaatri et al. 2009; Wöhl et al. 2010), but there is so far no agreement on which of the two hemispheres is rotating faster, or how the difference between the hemispheric rotation rates is changing in time.
The measured rotation rates, however, differ not only for different tracers of solar activity, but even for the same tracers when derived by different authors. The variation of the obtained rates for different tracers of solar activity can be understood by their different heights in the solar atmosphere, whence the radial differential rotation causes the observed variation (Vršnak et al. 1999). Discrepancies for the same tracers (for various authors) may be due to the time intervals and lengths of data included. Increasing evidence (Balthasar et al. 1986; Bai 2003; Knaack & Stenflo 2005; Knaack et al. 2005; Brajša et al. 2006, 2007; Balthasar 2007; Heristchi & Mouradian 2009) suggests that the solar differential rotation changes from cycle to cycle and even within one cycle. Bouwer (1992) claimed that precise rotation periods between 27 and 28 days persist only for a short time, sometimes only for a few solar rotations. Therefore both facts, the depth of the tracer in the solar atmosphere and the time of data, should be taken into account when studying solar differential rotation and its variation.
Many authors have also studied the non-axisymmetry of various types of solar activity, leading to the idea of active longitudes (Bumba & Howard 1969; Ambrož 1973; Balthasar & Schüessler 1983; Klimeš & Křivsky 1981; Gaizauskas et al. 1983; Brajša et al. 1992; Berdyugina & Usoskin 2003; Usoskin et al. 2005, 2007; Temmer et al. 2004, 2006; Ruždjak et al. 2005; Zhang et al. 2007a,b; Plyusnina 2010; Chen et al. 2011; Li 2011). The rotation properties of active longitudes may well differ from the rotation of the individual elements of solar surface activity.
We study here the long-term evolution of solar rotation in the two hemispheres by searching the best-fit rotation parameters for rather short-term fit periods. This allows us to better take into account the momentary variation of solar surface rotation, which is known to change within the solar cycle (Nesme-Ribes et al. 1993). To investigate the consistence of the best-fit values of the rotation parameters, five different fit intervals and methods were used: one-year fit interval, three-year separate, three-year running, five-year separate, and five-year running methods. (By “separate” we mean here consecutive, non-overlapping fit intervals of corresponding length, e.g., 1877−1879, 1880−1882 etc. for the three-year separate method. “Running” means that the fit interval is stepped forward by one year, e.g., 1877−1879, 1878−1880, etc. for the three-year running method, thus yielding fit parameters for the central year of the fit). We used the sunspot data collected by the Royal Greenwich Observatory and the USAF/NOAA for the years 1877−2008.
We also studied how the weighting of sunspots by their areas can affects the best-fit rotation parameters and the evolution of solar hemispheric rotation. In some previous studies (Usoskin et al. 2005; Zhang et al. 2011b), sunspots were weighted by their area in the merit function (see below; this method is called here the weight method). Weighting sunspots by their areas emphasizes the effect of large sunspots when finding the best-fit values of the rotation parameters. In a recent paper (Zhang et al. 2011c) we omitted the weight from the merit function. (This is called the no-weight method). However, we found that there was no major difference between the best-fit parameters when using the weight method or the no-weight method, and that the long-term evolution of solar surface rotation in the two hemispheres was fairly similar in the two methods.
We calculated the rotation parameters that best describe the differential rotation of active longitudes (AL) of sunspots and the related non-axisymmetries with the five different intervals and methods described above. We also compare the rotation rates obtained using the two different weightings. We study the long-term evolution of the solar rotation rates in the two hemispheres and compare the results obtained for different fit intervals and the two weighting methods. We find that, for all methods the hemispheric rotation rates depict a systematic long-term north-south asymmetry, which oscillates with an about 90-year period. The paper is organized as follows. The analysis method is described in the next Section. The results are presented in Sect. 3 and are discussed in more detail in Sect. 4. Section 5 presents our final conclusions.
2. Analysis method
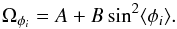
Differential rotation of the solar surface is usually described as  (1)where
Ωφ stands for the sidereal (all rotation rates are taken
here to be sidereal) angular velocity at latitude φ, A
(deg/day) denotes the equatorial angular velocity, and B and
C (deg/day) describe the differential rotation rate. When analyzing the
rotation of the ALs of sunspots, the last term in Eq. (1) is negligible since sunspots are almost always below 35°
and the value of corresponding to sin4φ is very low.
Accordingly, Eq. (1) becomes simply
(1)where
Ωφ stands for the sidereal (all rotation rates are taken
here to be sidereal) angular velocity at latitude φ, A
(deg/day) denotes the equatorial angular velocity, and B and
C (deg/day) describe the differential rotation rate. When analyzing the
rotation of the ALs of sunspots, the last term in Eq. (1) is negligible since sunspots are almost always below 35°
and the value of corresponding to sin4φ is very low.
Accordingly, Eq. (1) becomes simply
 (2)The normalized area of a
kth sunspot group in the ith rotation is defined as
(2)The normalized area of a
kth sunspot group in the ith rotation is defined as
 (3)where
Aik denotes the observed area of the sunspot
group. The area-weighted average latitude φi
during the ith rotation is defined as
(3)where
Aik denotes the observed area of the sunspot
group. The area-weighted average latitude φi
during the ith rotation is defined as  (4)Accordingly, the
angular velocity for the ith Carrington rotation can be described as
(4)Accordingly, the
angular velocity for the ith Carrington rotation can be described as
 (5)Assuming one AL in the
beginning to be at Carrington longitude Λ01, it will shift to longitude
Λik1 on the kth day of the
ith CR, which can be expressed as
(5)Assuming one AL in the
beginning to be at Carrington longitude Λ01, it will shift to longitude
Λik1 on the kth day of the
ith CR, which can be expressed as 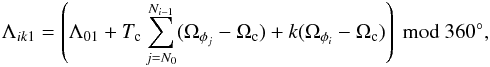 (6)where mod
360° means modulo within the longitude range [0°, 360°].
N0 and Ni − 1
stand for the CR numbers of the first and the (i − 1)th rotation in the
data set, Tc = 27.2753 days is the chosen data collection time
step (synodic Carrington rotation time), Ωc is the rotation rate of Carrington
frame (14.1844 deg/day sidereal), and k is the time of sunspot group
observation given as a fractional day in the (i − 1)th CR. The location of
the other AL is at Λ02 in the beginning and later at
Λik2 = Λik1 ± 180°,
i.e., opposite to Λik1. One can measure the distance
Δik between the longitudinal position
λik of a sunspot and one of the two AL
bands (Λik1 or Λik2) by
(6)where mod
360° means modulo within the longitude range [0°, 360°].
N0 and Ni − 1
stand for the CR numbers of the first and the (i − 1)th rotation in the
data set, Tc = 27.2753 days is the chosen data collection time
step (synodic Carrington rotation time), Ωc is the rotation rate of Carrington
frame (14.1844 deg/day sidereal), and k is the time of sunspot group
observation given as a fractional day in the (i − 1)th CR. The location of
the other AL is at Λ02 in the beginning and later at
Λik2 = Λik1 ± 180°,
i.e., opposite to Λik1. One can measure the distance
Δik between the longitudinal position
λik of a sunspot and one of the two AL
bands (Λik1 or Λik2) by
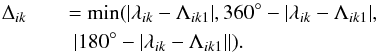 (7)This
distance is the longitude difference of a sunspot from the nearest AL.
(7)This
distance is the longitude difference of a sunspot from the nearest AL.
The merit function can be defined as the mean square of these distances for all sunspots
either without any weighting on sunspots as follows (Zhang
et al. 2011c): 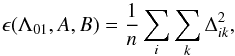 (8)or by weighting the
sunspots by their areas (Usoskin et al. 2005; Zhang et al. 2011b):
(8)or by weighting the
sunspots by their areas (Usoskin et al. 2005; Zhang et al. 2011b):  (9)In these equations
n denotes the total number of sunspots and the merit function depends on
the three parameters Λ01, A, and B. Using a
least-squares fit progress we search for the minimum of the merit function, where the three
parameters have their best-fit values. The search interval for the A is
within [13.5, 15.0] (deg/day) in steps of 0.01 (deg/day), for B within
[−5.0, 0.0] (deg/day) in steps of 0.01 (deg/day), and for Λ01 within
[0°, 360°] in steps of 1° (for more detail, see Usoskin et al. 2005; Zhang et al. 2011b).
(9)In these equations
n denotes the total number of sunspots and the merit function depends on
the three parameters Λ01, A, and B. Using a
least-squares fit progress we search for the minimum of the merit function, where the three
parameters have their best-fit values. The search interval for the A is
within [13.5, 15.0] (deg/day) in steps of 0.01 (deg/day), for B within
[−5.0, 0.0] (deg/day) in steps of 0.01 (deg/day), and for Λ01 within
[0°, 360°] in steps of 1° (for more detail, see Usoskin et al. 2005; Zhang et al. 2011b).
3. Results
3.1. Variation of the rotation rate at the average latitude
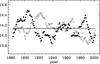 |
Fig. 1 Yearly rotation rates Ω17 at the average latitude of 17° in the north (filled circles) and south (open circles) calculated for three-year running fit intervals and no weighting, and smoothed over 11 points (solar cycle). Horizontal line denotes the mean value of Ω17 over the whole time period. |
Figure 1 shows the rotation rate values Ω17 at the reference latitude of 17° in the two hemispheres obtained for the three-year running interval method using no weighting in the merit function. To depict the long-term (multi-decadal) variation of the rotation rate more clearly, we smoothed the yearly Ω17 values over 11 points (solar cycle). The horizontal line gives the average (14.130 ± 0.030 deg/day) of the annual Ω17 values in the two hemispheres over the whole time period. This value agrees well with our previous result (Zhang et al. 2011b).
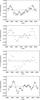 |
Fig. 3 North-south asymmetry (N-S)/(N+S) in Ω17 for the (from top to bottom) one-year, three-year separate, five-year separate and five-year running fit intervals and no weighting. Three-year separate and five-year separate values were smoothed over three points. |
Figure 1 shows that the rotation rates vary around the mean by up to ±(3−4)%. The fastest rotation rates in the north are found around the turn of the 19th and 20th century and in the late 1980s, while rotation was slower from 1920s to 1940s and in the late 1990s. Rotation in the south was highest in the 1920s and lowest in the early 1900s and around 1990. Note that the highest rotation rates in the north and the lowest rates in the south repeat after 80−90 years in each case, suggesting a related periodicity in rotation.
Moreover, the maxima in the north and the minima in the south occur roughly at the same time, which leads to an approximate anti-correlation in the long-term evolution of the rotation of ALs in the two hemispheres. Thus, there is a significant, systematically varying difference between the rotation rates in the two hemispheres. We have depicted this north-south asymmetry in rotation (defined as (N − S)/(N + S)) in Fig. 2. Note that the 80−90-year oscillation is also clearly seen in the N-S asymmetry. The two maxima in the N-S asymmetry occur at about 1900 and in the late 1980s, and the minimum in the 1920s.
We also calculated the Ω17 values in the northern and southern hemispheres for the four other fit intervals and methods (one-year, three-year separate, five-year separate, and five-year running methods) using the respective best-fit values of rotation parameters obtained for the no-weight method. We found that for all these alternative fit methods, the long-term evolution of Ω17 in the two hemispheres is very similar to that depicted in Fig. 1 for the three-year running method. As the most important result for the present paper, we depict in Fig. 3 the N-S asymmetry for all these four methods. Figure 3 shows a very similar long-term evolution of the N-S asymmetry. In particular, the quasi-period of about 80−90 years in the N-S asymmetry is obtained for all five fit methods. Moreover, despite the small differences between the methods, the absolute level of maximum and minimum asymmetries remains fairly similar. The amplitude of the 80−90-year asymmetry oscillation is about ±2%.
Figure 4 presents the values of Ω17 in the two hemispheres obtained for the three-year running fit interval but using weighting by sunspot area according to Eq. (9). The mean value of Ω17 in the two hemispheres over the whole time period (14.123 ± 0.030 deg/day) is very close to the value obtained with the no-weight method. Moreover, the long-term evolution of Ω17 in Fig. 4 is very similar to that in Fig. 1, and depicts the same 80−90-year periodicity in both hemispheres as in Fig. 1. These facts show that weighting causes only rather small changes to the main rotation features of active longitudes.
However, the relative heights of the two maxima of Ω17 in the north and the absolute value of the minimum (maximum) in the 1920s in the north (south) are slightly modified by weighting. These differences lead to a slightly lower maximum (minimum) at about 1900 (in the 1920s) and to a slightly higher maximum in the 1980s in the N-S asymmetry in the weight method, as depicted in Fig. 5. Also, overall, the absolute value of N-S asymmetry obtained using weighting is slightly lower than that obtained with the no-weight method.
Finally, we note that the four additional fit methods yield a long-term evolution of the solar rotation in the two hemispheres for the weight method (not shown) roughly similar to that obtained with the three-year running fit method and weighting (and depicted in Fig. 4. In particular, all these methods show an anti-correlation between the rotation rates in the two hemipshers and the 80−90-year oscillation of the N-S asymmetry. These results strongly suggest that the long-term quasi-periodicity is not dependent on the method used.
3.2. Non-axisymmetry
We define the measure of non-axisymmetry Γ as follows
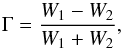 (10)where
W1 and W2 denote the normalized
area of sunspots that appeared within (W1) or outside
(W2) the two ALs, which are taken here as the two
90°-longitude bands
(10)where
W1 and W2 denote the normalized
area of sunspots that appeared within (W1) or outside
(W2) the two ALs, which are taken here as the two
90°-longitude bands  where
Λik denotes either of the two ALs.
where
Λik denotes either of the two ALs.
The average values of Γ for the five fit intervals are listed in Table 1 for the no-weight method. The average non-axisymmetry is stronger for short time intervals, increasing from 0.280 (0.291) for the five-year running method to 0.464 (0.470) for the one-year method in the northern (southern) hemisphere.
The corresponding fractions of sunspots in the active longitudes are 64.0% (64.6%) for the five-year running method and 73.2% (73.5%) for the one-year method in the northern (southern) hemisphere. Since the rotation rates vary on a time scale of one year, the rotation parameters obtained for the shorter intervals represent the momentary rotation rate values of active longitudes more closely. Accordingly, the ALs are more accurately determined from shorter intervals, which leads to stronger non-axisymmetries.
Comparison of the results obtained with five fit intervals and no-weight method.
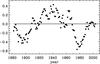 |
Fig. 6 North-south asymmetry (N-S)/(N+S) of the total sunspot group area above 2000 μHem. |
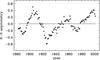 |
Fig. 7 North-south asymmetry (N-S)/(N+S) of the parameter B for the three-year running fit method and no weighting. |
4. Discussion
Figure 6 shows the difference between the total area of sunspot groups with an area larger than 2000 μHem in the northern and southern hemispheres, i.e., the N-S asymmetry of large sunspot groups. One can see that the southern hemisphere was significantly more active in large sunspots than the northern hemisphere around 1900. Then the asymmetry reversed, with the north being dominant from the 1920s until the 1960s. (The asymmetry is fluctuating considerably from 1940 to 1960). Thereafter, the asymmetry reversed again and reached its minimum around 1980. Accordingly, the N-S asymmetry of large sunspots (Fig. 6) shows a clear anti-correlation with the N-S asymmetry of solar surface rotation (see, e.g., Figs. 2 or 5). Note also that the sunspot N-S asymmetry also depicts a similar 80−90-year oscillation as the rotation asymmetry.
Several studies have noted the anti-correlation between solar rotation and sunspot areas (Howard 1984; Hathaway & Wilson 1990; Brajša et al. 2006). This anti-correlation also supports the finding (Howard et al. 1984) that large sunspots rotate slower than small spots. One possible reason for the anti-correlation between solar rotation and large sunspots is that large sunspots have deeper-rooted structures originating from the interaction region of the convection zone and the radiative core. The radial differential rotation profile obtained from helioseismic inversion shows that at low- to mid-latitudes, where sunspot appear, the rotation rate decreases with depth over most of the convection layer. If the slower rotation rate of large sunspots is indeed caused by their deeper roots close to the bottom of the convection zone, the large sunspots should also have a more rigid latitudinal differential rotation profile since they are closer to the rigidly rotating radiative core. Interestingly, this possibility can be studied with the rotation parameter B.
Figure 7 shows the N-S asymmetry of the parameter B for the three-year running fit without weighting. The N-S asymmetry of B depicts quite a similar evolution as the rotation N-S asymmetry (see, e.g., Fig. 2). (Only the last maximum is obtained slightly later in the B asymmetry). Accordingly, it also has a fair inverse relationship with the N-S asymmetry of sunspot area. This implies that large sunspot groups indeed tend to rotate less differentially (more rigidly) than small sunspots. The physical reason for this relationship can be understood from recent 3D MHD simulations of the interaction between differential rotation and magnetic fields in the convection zone (Brun 2004; Brun et al. 2004). These simulations show that Maxwell stresses, which are enhanced in large sunspot areas, tend to oppose Reynolds stresses and speed up the poles, reducing the latitudinal angular velocity contrast. Maxwell stresses are also suggested to be the cause of the temporal variation of differential rotation and torsional oscillation in young solar-like stars (Lanza 2006, 2007). We also note that the 80−90-year oscillation in the relative rotation rates of the two hemispheres suggests that there is a systematic interchange of angular momentum between the two hemispheres. While the mutual long-term phasing of solar activity in the two hemispheres also suggests a coupling between the two hemispheres, the present observation explicitly requires the exchange of angular momentum in this coupling (Chatterjee & Choudhuri 2006; Goel & Choudhuri 2009).
Figures 1 and 2 (and most plots in Figs. 3 to 5) show that the average rotation rate of ALs of sunspots in the northern hemisphere was higher than in the south during cycles 21−22 and early in cycle 23 (years 1976−1998 in Fig. 2). This recent N-S asymmetry with a higher rotation rate in the north agrees with the results found for ALs, as determined from solar X-ray flares (Zhang et al. 2008, 2011a; Bai 2003), and with the results found for the rotation of Hα filaments (Brajša et al. 1997) and low-brightness regions (Brajša et al. 2000), but differs from the rotation found from magnetic flux (Song et al. 2011), Doppler velocities (Hathaway et al. 1996), and daily radio flux (Heristchi & Mouradian 2009). These differences may be, as discussed above, due to different methods, different time intervals, or real differences in rotation of features anchored at different depths in the solar atmosphere. For a review on the techniques and features used in solar differential rotation measurements, see Beck (2000) and Rozelot & Neiner (2009).
The long-term variation of solar surface rotation obtained here from short fit intervals agrees well with those obtained previously with longer (1-cycle and 3-cycle) fit intervals during cycles 15−22 (Zhang et al. 2011b,c). During this period the rotation of northern hemisphere continues to increase fairly systematically, while it decreases in the southern hemisphere (see, e.g., Figs. 1 and 4).
The main difference between the rotation results based on shorter (five-year and less) interval fits and long (1-cycle or longer) interval fits are found in the beginning of the studied time interval, e.g., in cycles 13 and 14. While we find here that short fit intervals consistently yield a maximum in rotation rate in the north and a lower rate in the south at around 1900, the longer fits yield lower values in the north and higher values in the south (see, e.g., Fig. 5 in Zhang et al. 2011b). Moreover, the weight-method (Zhang et al. 2011b) and the no-weight method (Zhang et al. 2011c) give rather different results especially in the southern hemisphere for the first 3-cycle period around cycle 13. This suggests that, during the very weak solar activity at this time, the weighting method (weight vs. no-weight) has a particularly important role for the results obtained on rotation. This difference seems to be amplified for the longer fit intervals, which cover long periods of greatly different solar activity. On the other hand, the consistency of the results presented here based on shorter fit intervals and even with the two different weighting methods suggests that the shorter fit intervals follow the momentary rotation more reliably. Most likely, the shorter fit intervals yield a more accurate and realistic view of the long-term evolution of solar rotation in the two hemispheres.
The value of non-axisymmetry was found to increase when using shorter fit lengths, in agreement with asymmetries found previously for even longer fit periods from one solar cycle to twelve cycles (Zhang et al. 2011b). This is due to the short-term variation of the rotation rate. Solar rotation rate varies at quite short time scales (Javaraiah & Komm 1999), sometimes remaining consistent only for a few solar rotations (Bouwer 1992).
The variation of the rotation rate of ALs is complicated by the fact that active longitudes involve all sunspots, which have a large variability in angular velocity depending on their latitude, size and age. The rotation rate of sunspots varies with area and age (Ward 1966; Howard et al. 1984; Zappalá & Zuccarello 1991), which has been suggested to be due to the different anchor depths of different types of sunspots (Nesme-Ribes et al. 1993; Rhodes et al. 1990). Moreover, the differential rotation of all tracers of rotation is also affected by large- and small-scale flows, such as torsional oscillations (Covas et al. 2001; Howe et al. 2009; Antia & Basu 2010), meridional flows (Javaraiah & Ulrich 2006; Javaraiah 2010; Nandy et al. 2011), supergranules (Beck & Schou 2000), etc. Therefore, shortening the fit period reveals the detailed variation of rotation at short time scales, yielding more accurate momentary rotation rates, stronger non-axisymmetries and and a higher accuracy when finding ALs. However, very short interval fits of a few solar rotations only may lose the continuous evolution of rotational phase and thereby cause increased uncertainty when determining the rotation parameters. We find here that the three-year fit interval length provides the best fit when both effects are considered.
5. Conclusions
Applying the least-square fit method to the longitudes of sunspots in a dynamic, differentially rotating reference system, we have determined the differential rotation parameters (A, B, and Λ01) of the active longitudes of sunspots in 1877−2008 with five different fit intervals and two different weighting methods. Based on the best-fit values of the rotation parameters obtained for each year, we determined the variation of rotation rate at the reference latitude of 17° over the whole period.
We found that the long-term evolution of solar surface rotation using sunspots indicates a clear quasi-periodicity of about 80−90 years in both hemispheres. Rotation rates vary around the mean by up to ±3−4%.
The variations of rotation in the northern and southern hemisphere are closely anti-correlated (with only a minor phase lag). Higher rotation rates in the north were found around 1900 and in the 1980s, and lower rates in the 1920s−1940s. This means that there is a systematic 80−90-year quasi-periodicity in the north-south asymmetry in sunspot rotation. The amplitude of the 80−90-year asymmetry oscillation (defined by (N-S)/(N+S)) is about ±2%.
We found a similar 80−90-year quasi-periodicity in the north-south asymmetry of the large sunspot activity, in anti-phase with the rotation asymmetry. The anti-phasing confirms previous results on the inverse relationship between sunspot rotation and area (Howard et al. 1984; Howard 1984; Hathaway & Wilson 1990; Brajša et al. 2006). The 80−90-year periodicity may also be related to the Gleissberg cycle (Gleissberg 1971). A 70-year variation in the asymmetry of the ascending and descending phases of solar activity was found previously (Brajša et al. 2009).
The long-term evolution of the north-south rotation asymmetry closely follows the latitudinal contrast of differential rotation, which further supports the intimate connection of the variations of rotation and large sunspot areas.
These results on the sunspot rotation remain essentially unchanged for all five studied fit intervals (from 1 to 5 years) and for the two weighting methods (no weighting and weighting by sunspot areas).
Acknowledgments
The research leading to these results has received funding from the European Commission’s Seventh Framework Programme (FP7/2007-2013) under the grant agreement eHeroes (project N° 284461, www.eheroes.eu). We also acknowledge the financial support by the Academy of Finland to the HISSI research project N° 128189.
References
- Ambrož, P. 1973, Bull. Astron. Inst. Czech., 24, 80 [NASA ADS] [Google Scholar]
- Antia, H. M., & Basu, S. 2010, ApJ, 720, 494 [NASA ADS] [CrossRef] [Google Scholar]
- Antonucci, E., Hoeksema, J. T., & Scherrer, P. H. 1990, ApJ, 360, 296 [NASA ADS] [CrossRef] [Google Scholar]
- Bai, T. 2003, ApJ, 591, 406 [NASA ADS] [CrossRef] [Google Scholar]
- Balthasar, H. 2007, A&A, 471, 281 [NASA ADS] [CrossRef] [EDP Sciences] [Google Scholar]
- Balthasar, H., & Schüessler, M. 1983, Sol. Phys., 87, 23 [NASA ADS] [CrossRef] [Google Scholar]
- Balthasar, H., & Wöhl, H. 1980, A&A, 92, 111 [NASA ADS] [Google Scholar]
- Balthasar, H., Vázquez, M., & Wöhl, H. 1986, A&A, 155, 87 [NASA ADS] [Google Scholar]
- Beck, J. G. 2000, Sol. Phys., 191, 47 [NASA ADS] [CrossRef] [Google Scholar]
- Beck, J. G., & Schou, J. 2000, Sol. Phys., 193, 333 [NASA ADS] [CrossRef] [Google Scholar]
- Berdyugina, S. V., & Usoskin, I. G. 2003, A&A, 405, 1121 [NASA ADS] [CrossRef] [EDP Sciences] [Google Scholar]
- Bouwer, S. D. 1992, Sol. Phys., 142, 365 [NASA ADS] [CrossRef] [Google Scholar]
- Brajša, R., Vršnak, B., Ruždjak, V., et al. 1992, Hvar Obs. Bull., 16, 13 [NASA ADS] [Google Scholar]
- Brajša, R., Ruždjak, V., Vršnak, B., et al. 1997, Sol. Phys., 171, 1 [NASA ADS] [CrossRef] [Google Scholar]
- Brajša, R., Ruždjak, V., Vršnak, B., et al. 2000, Sol. Phys., 196, 279 [NASA ADS] [CrossRef] [Google Scholar]
- Brajša, R., Ruždjak, D., & Wöhl, H. 2006, Sol. Phys., 237, 365 [NASA ADS] [CrossRef] [Google Scholar]
- Brajša, R., Wöhl, H., Ruždjak, D., et al. 2007, Astron. Nachr., 328, 1013 [NASA ADS] [CrossRef] [Google Scholar]
- Brajša, R., Wöhl, H., Hanslmeier, A., et al. 2009, A&A, 496, 855 [NASA ADS] [CrossRef] [EDP Sciences] [Google Scholar]
- Brun, A. S. 2004, Sol. Phys., 220, 333 [NASA ADS] [CrossRef] [Google Scholar]
- Brun, A. S., Miesch, M. S., & Toomre, J. 2004, ApJ, 614, 1073 [NASA ADS] [CrossRef] [Google Scholar]
- Bumba, V., & Howard, R. 1969, Sol. Phys., 7, 28 [Google Scholar]
- Chatterjee, P., & Choudhuri, A. R. 2006, Sol. Phys., 239, 29 [NASA ADS] [CrossRef] [Google Scholar]
- Chen, A. Q., Wang, J. X., Li, J. W., Feynman, J., & Zhang, J. 2011, A&A, 534, A47 [NASA ADS] [CrossRef] [EDP Sciences] [Google Scholar]
- Covas, E., Tavakol, R., & Moss, D. 2001, A&A, 371, 718 [NASA ADS] [CrossRef] [EDP Sciences] [Google Scholar]
- Gaizauskas, V., Harvey, K. L., Harvey, J. W., & Zwaan, C. 1983, ApJ, 265, 1056 [NASA ADS] [CrossRef] [Google Scholar]
- Georgieva, K., Kirov, B., Javaraiah, J., & Krasteva, R. 2005, Planet. Space Sci., 53, 197 [NASA ADS] [CrossRef] [Google Scholar]
- Gigolashvili, M. S., Japaridze, D. R., Mdzinarishvili, T. G., Chargeishvili, B. B., & Kukhianidze, V. J. 2007, Adv. Space Res., 40, 976 [NASA ADS] [CrossRef] [Google Scholar]
- Gilman, P. A., & Howard, R. 1984, ApJ, 283, 385 [NASA ADS] [CrossRef] [Google Scholar]
- Gleissberg, W. 1971, Sol. Phys., 21, 240 [NASA ADS] [CrossRef] [Google Scholar]
- Goel, A., & Choudhuri, A. R. 2009, RA&A, 9, 115 [Google Scholar]
- Hathaway, D. H., & Wilson, R. M. 1990, ApJ, 357, 271 [NASA ADS] [CrossRef] [Google Scholar]
- Hathaway, D. H., Gilman, P. A., Harvey, J. W., et al. 1996, Science, 272, 1306 [NASA ADS] [CrossRef] [Google Scholar]
- Heristchi, D., & Mouradian, Z. 2009, A&A, 497, 835 [NASA ADS] [CrossRef] [EDP Sciences] [Google Scholar]
- Howard, R. 1984, ARA&A, 22, 131 [NASA ADS] [CrossRef] [Google Scholar]
- Howard, R., Gilman, P. I., & Gilman, P. A. 1984, ApJ, 283, 373 [NASA ADS] [CrossRef] [Google Scholar]
- Howe, R., Christensen-Dalsgaard, J., Hill, F., et al. 2009, ApJ, 701, L87 [NASA ADS] [CrossRef] [Google Scholar]
- Javaraiah, J. 2003, Sol. Phys., 212, 23 [NASA ADS] [CrossRef] [Google Scholar]
- Javaraiah, J. 2010, A&A, 509, A30 [NASA ADS] [CrossRef] [EDP Sciences] [Google Scholar]
- Javaraiah, J., & Komm, R. W. 1999, Sol. Phys., 184, 41 [NASA ADS] [CrossRef] [Google Scholar]
- Javaraiah, J., & Ulrich, R. K. 2006, Sol. Phys., 237, 245 [NASA ADS] [CrossRef] [Google Scholar]
- Klimeš, J., & Křivsky, L. 1981, Bull. Astron. Inst. Czech., 32, 222 [NASA ADS] [Google Scholar]
- Knaack, R., & Stenflo, J. O. 2005, A&A, 438, 349 [NASA ADS] [CrossRef] [EDP Sciences] [Google Scholar]
- Knaack, R., Stenflo, J. O., & Berdyugina, S. V. 2005, A&A, 438, 1067 [NASA ADS] [CrossRef] [EDP Sciences] [Google Scholar]
- Lanza, A. F. 2006, MNRAS, 373, 819 [NASA ADS] [CrossRef] [Google Scholar]
- Lanza, A. F. 2007, A&A, 471, 1011 [NASA ADS] [CrossRef] [EDP Sciences] [Google Scholar]
- Li, J. 2011, ApJ, 735, 130 [NASA ADS] [CrossRef] [Google Scholar]
- Li, K. J., Shi, X. J., Liang, H. F., et al. 2011, ApJ, 730, 49 [NASA ADS] [CrossRef] [Google Scholar]
- Meunier, N., Nesme-Ribes, E., & Grosso, N. 1997, A&A, 319, 673 [NASA ADS] [Google Scholar]
- Mursula, K., & Hiltula, T. 2004, Sol. Phys., 224, 133 [Google Scholar]
- Nandy, D., Muñoz-Jaramillo, A., & Martens, P. C. H. 2011, Nature, 471, 80 [NASA ADS] [CrossRef] [Google Scholar]
- Nash, A. G., Sheeley, Jr., N. R., & Wang, Y.-M. 1988, Sol. Phys., 117, 359 [NASA ADS] [CrossRef] [Google Scholar]
- Nesme-Ribes, E., Ferreira, E. N., & Mein, P. 1993, A&A, 274, 563 [NASA ADS] [Google Scholar]
- Plyusnina, L. A. 2010, Sol. Phys., 261, 223 [NASA ADS] [CrossRef] [Google Scholar]
- Pulkkinen, P., & Tuominen, I. 1998, A&A, 332, 748 [NASA ADS] [Google Scholar]
- Rhodes, Jr., E. J., Cacciani, A., Korzennik, S., et al. 1990, ApJ, 351, 687 [NASA ADS] [CrossRef] [Google Scholar]
- Rozelot, J.-P., & Neiner, C., eds. 2009, The Rotation of Sun and Stars, Lect. Notes Phys. (Berlin: Springer Verlag), 765 [Google Scholar]
- Ruždjak, V., Ruždjak, D., Brajša, R., Temmer, M., & Hanslmeier, A. 2005, Hvar Obs. Bull., 29, 117 [NASA ADS] [Google Scholar]
- Rybák, J. 1994, Sol. Phys., 152, 161 [NASA ADS] [CrossRef] [Google Scholar]
- Rybák, J. 2000, Hvar Obs. Bull., 24, 135 [NASA ADS] [Google Scholar]
- Sheeley, Jr., N. R., Wang, Y.-M., & Nash, A. G. 1992, ApJ, 401, 378 [NASA ADS] [CrossRef] [Google Scholar]
- Song, W. B., Feng, X. S., Shen, F., & Guo, J. P. 2011, Sol. Phys., 270, 35 [NASA ADS] [CrossRef] [Google Scholar]
- Temmer, M., Veronig, A., Rybák, J., Brajša, R., & Hanslmeier, A. 2004, Sol. Phys., 221, 325 [NASA ADS] [CrossRef] [Google Scholar]
- Temmer, M., Veronig, A., Rybák, J., Brajša, R., & Hanslmeier, A. 2006, Adv. Space Res., 38, 886 [NASA ADS] [CrossRef] [Google Scholar]
- Usoskin, I. G., Berdyugina, S. V., & Poutanen, J. 2005, A&A, 441, 347 [NASA ADS] [CrossRef] [EDP Sciences] [Google Scholar]
- Usoskin, I. G., Berdyugina, S. V., Moss, D., & Sokoloff, D. D. 2007, Adv. Space Res., 40, 951 [NASA ADS] [CrossRef] [Google Scholar]
- Vršnak, B., Roša, A., Božić, H., et al. 1999, Sol. Phys., 185, 207 [NASA ADS] [CrossRef] [Google Scholar]
- Wang, Y.-M., Sheeley, Jr., N. R., Nash, A. G., & Shampine, L. R. 1988, ApJ, 327, 427 [NASA ADS] [CrossRef] [Google Scholar]
- Ward, F. 1966, ApJ, 145, 416 [NASA ADS] [CrossRef] [Google Scholar]
- Wöhl, H., Brajša, R., Hanslmeier, A., & Gissot, S. F. 2010, A&A, 520, A29 [NASA ADS] [CrossRef] [EDP Sciences] [Google Scholar]
- Zaatri, A., Wöhl, H., Roth, M., Corbard, T., & Brajša, R. 2009, A&A, 504, 589 [NASA ADS] [CrossRef] [EDP Sciences] [Google Scholar]
- Zappalá, R. A., & Zuccarello, F. 1991, A&A, 242, 480 [NASA ADS] [Google Scholar]
- Zhang, L. Y., Cui, Y. M., He, Y. L., et al. 2007a, Adv. Space Res., 40, 970 [NASA ADS] [CrossRef] [Google Scholar]
- Zhang, L. Y., Wang, H. N., Du, Z. L., Cui, Y. M., & He, H. 2007b, A&A, 471, 711 [NASA ADS] [CrossRef] [EDP Sciences] [Google Scholar]
- Zhang, L. Y., Wang, H. N., & Du, Z. L. 2008, A&A, 484, 523 [NASA ADS] [CrossRef] [EDP Sciences] [Google Scholar]
- Zhang, L., Mursula, K., Usoskin, I., & Wang, H. 2011a, J. Atmosph. Sol.-Terrestr. Phys., 73, 258 [Google Scholar]
- Zhang, L., Mursula, K., Usoskin, I., & Wang, H. 2011b, A&A, 529, A23 [NASA ADS] [CrossRef] [EDP Sciences] [Google Scholar]
- Zhang, L., Mursula, K., Usoskin, I., Wang, H., & Du, Z. 2011c, 1st Asia-Pacific Solar Physics Meet., ASI Conf. Ser., 2, 175 [NASA ADS] [Google Scholar]
All Tables
All Figures
|
Fig. 1 Yearly rotation rates Ω17 at the average latitude of 17° in the north (filled circles) and south (open circles) calculated for three-year running fit intervals and no weighting, and smoothed over 11 points (solar cycle). Horizontal line denotes the mean value of Ω17 over the whole time period. |
| In the text | |
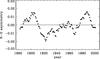 |
Fig. 2 North-south asymmetry (N-S)/(N+S) in Ω17 obtained from Fig. 1. |
| In the text | |
|
Fig. 3 North-south asymmetry (N-S)/(N+S) in Ω17 for the (from top to bottom) one-year, three-year separate, five-year separate and five-year running fit intervals and no weighting. Three-year separate and five-year separate values were smoothed over three points. |
| In the text | |
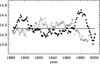 |
Fig. 4 As Fig. 1, but using weighting. |
| In the text | |
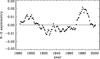 |
Fig. 5 North-south asymmetry (N-S)/(N+S) in Ω17 obtained from Fig. 4. |
| In the text | |
|
Fig. 6 North-south asymmetry (N-S)/(N+S) of the total sunspot group area above 2000 μHem. |
| In the text | |
|
Fig. 7 North-south asymmetry (N-S)/(N+S) of the parameter B for the three-year running fit method and no weighting. |
| In the text | |
Current usage metrics show cumulative count of Article Views (full-text article views including HTML views, PDF and ePub downloads, according to the available data) and Abstracts Views on Vision4Press platform.
Data correspond to usage on the plateform after 2015. The current usage metrics is available 48-96 hours after online publication and is updated daily on week days.
Initial download of the metrics may take a while.