Fig. 7
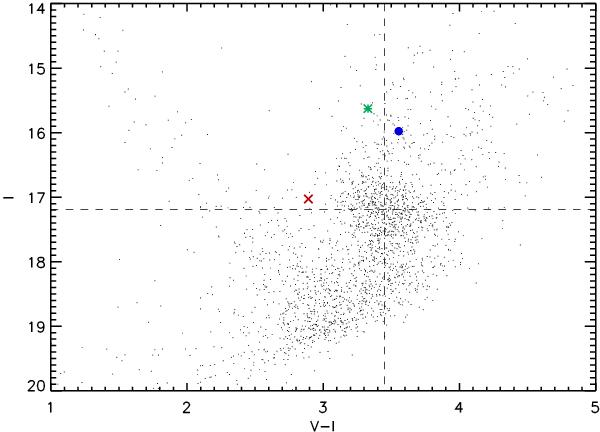
V − I,I colour–magnitude diagram of the OGLE-2011-BLG-0251 field obtained using OGLE-IV photometry. The location of the total source + blend is indicated by a green asterisk, while the location of the deblended source is marked by a blue filled circle, and that of the blend by a red cross. The dashed lines cross at the location of the Red Clump.
Current usage metrics show cumulative count of Article Views (full-text article views including HTML views, PDF and ePub downloads, according to the available data) and Abstracts Views on Vision4Press platform.
Data correspond to usage on the plateform after 2015. The current usage metrics is available 48-96 hours after online publication and is updated daily on week days.
Initial download of the metrics may take a while.