Fig. 2
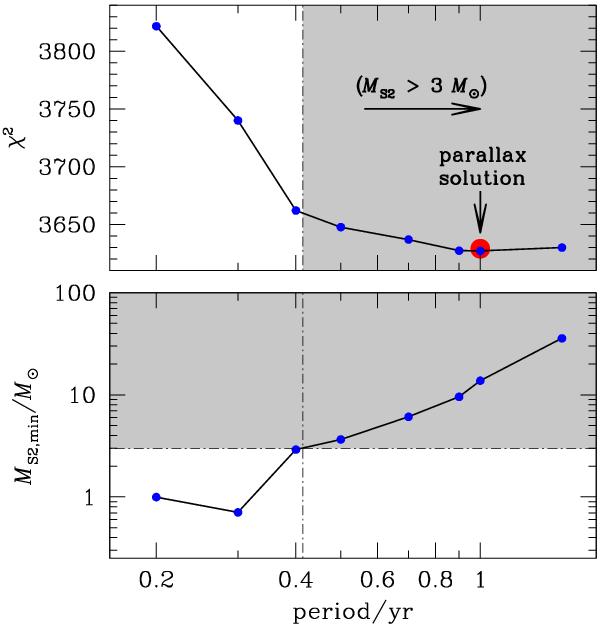
Constraints from the xallarap fit as a function of the orbital period P of the source star. The top panel shows χ2 of the xallarap fit as a function of P, with a red circle marking the location of the best parallax model. The bottom panel shows the minimum mass of the source companion as a function of P. The shaded area in both panels indicates where models are excluded based on conservative blending constraints on the source companion’s mass.
Current usage metrics show cumulative count of Article Views (full-text article views including HTML views, PDF and ePub downloads, according to the available data) and Abstracts Views on Vision4Press platform.
Data correspond to usage on the plateform after 2015. The current usage metrics is available 48-96 hours after online publication and is updated daily on week days.
Initial download of the metrics may take a while.