| Issue |
A&A
Volume 552, April 2013
|
|
|---|---|---|
| Article Number | A54 | |
| Number of page(s) | 10 | |
| Section | Interstellar and circumstellar matter | |
| DOI | https://doi.org/10.1051/0004-6361/201220486 | |
| Published online | 25 March 2013 | |
Porous dust grains in debris disks
Institut für Theoretische Physik und Astrophysik, Christian-Albrechts – Universität zu Kiel, Leibnizstraße 15, 24098 Kiel, Germany
e-mail: This email address is being protected from spambots. You need JavaScript enabled to view it.
Received: 2 October 2012
Accepted: 25 January 2013
Abstract
Aims. When modeling the density and grain size distribution in debris disks, the minimum particle size is often significantly larger than the corresponding blowout size. While the dust particles are usually modeled as compact, homogenous spheres, we instead investigate the impact of porosity. The optical properties of porous particles are determined, and the influences of porosity on the blowout size and dust temperatures investigated.
Methods. Using the method of discrete dipole approximation, we calculate the scattering and absorption cross sections of porous particles and derive the blowout size and the behavior of the dust temperature.
Results. We determine the efficiency factors of absorption and the radiation pressure for porous particles, and investigate the influence on the β-ratio. Blowout sizes are calculated for various stellar luminosities and porosities, and an approximation equation is derived to estimate the blowout size as a function of these parameters. Furthermore, we investigate the influence of the porosity on the dust equilibrium temperature.
Conclusions. The blowout size increases with the particle porosity and stellar luminosity. The dust temperature of porous particles is lower than the one of the compact spheres; in particular, the temperature of blowout grains decreases for porous particles.
Key words: circumstellar matter / protoplanetary disks / infrared: stars / interplanetary medium / scattering
© ESO, 2013
1. Introduction
Debris disks contain micrometer-sized dust grains, which can be observed in scattered light in the optical to near-infrared wavelength range and by thermal emission at longer wavelengths. To interpret observations of debris disks these particles are often assumed to be compact, homogenous, and spherical (e.g. Roccatagliata et al. 2009; Ertel et al. 2011, 2012). This is a convenient simplification, since it makes the Mie scattering formalism applicable (Mie 1908; Wolf & Voshchinnikov 2004). However, there are various processes that would tend to create more complex, e.g. inhomogeneous or almost arbitrarily shaped, particles, instead. In cold clouds gas molecules can freeze out on the surface of dust grains, so that the particles are composed of multilayer, inhomogeneous materials (Krügel 2003). In young, gas-rich circumstellar disks, collisions of particles occur in which the dust grains either agglomerate and form larger particles or get shattered in fragments with complex shapes. In this context, porosity might support the grain growth process in the disk (Blum & Wurm 2008).
Modeling recent observations of dust in various environments also motivates the concept of porous dust grains. For example, van Breemen et al. (2011) used a distribution of hollow spheres to fit the 9.7 μm silicate absorption profile of the ISM based on the model of Min et al. (2005). Demyk et al. (1999) applied some degree of porosity, which was necessary to reproduce silicate features in the spectrum of dust around the protostellar objects RAFGL 7009S and IRAS 19110+1045. Scattered light images of the circumstellar disk surrounding the T Tauri star IM Lupi may indicate the presence of fluffy aggregates (Pinte et al. 2008). Birnstiel et al. (2010) and Ricci et al. (2010, 2012) used porous spherical grains to specify the dust opacity in a sample of young protoplanetary disks. For a general study of the influence of porosity on the dust opacity in protoplanetary disks, see Semenov et al. (2003).
Modeling debris disks is an important part of understanding the evolution and formation of stellar disks, hence the evolution of planetary systems. With that in mind, Augereau et al. (1999, 2001), Wyatt & Dent (2002), and Fitzgerald et al. (2007) used porous grains for disk modeling, resulting in suitable approaches to reproduce observational data of HR 4796 A, β Pictoris, Fomalhaut, and AU Microscopii, respectively. Acke et al. (2012) found evidence of fluffy aggregates in the disk of Fomalhaut. These are required for the thermal emission characteristic of small grains and the scattering behavior of large particles. A dependence exists between grain porosity and dust temperature (Greenberg & Hage 1990; Voshchinnikov et al. 2006), causing a shift in the infrared emission to longer wavelengths.
Our study is motivated by the fact that debris disk modeling using compact grains often reveals a significant discrepancy between the minimum particle size and the calculated blowout size (e.g. Roccatagliata et al. 2009; Ertel et al. 2011). The influence of porosity on the radiation pressure has already been considered in previous studies. Mukai et al. (1992) and Kimura et al. (1997) examined the β-ratio for fractal aggregates using effective medium theory, while Köhler et al. (2007) applied discrete dipole approximation. We investigate porous particles and outline various aspects as the absorption efficiency factor, the blowout size, and dust temperatures. In Sect. 2 we provide an overview of the applied numerical tool for calculating the efficiency factors and describe our model of porous dust grains. The analysis of the absorption cross sections is presented in Sect. 3, and the blowout size as a function of selected parameters is discussed in Sect. 4. Finally, we present the equilibrium temperature of porous dust particles in Sect. 5.
2. Calculation methods
2.1. Porous grain model
Within the infinite variety of porous particles we consider those that are spherical and from which material is removed so that voids are formed. The advantage of this model is the small number of parameters describing each particle. A debris disk contains a vast number of grains of different shapes, sizes, and orientations. The appearance of the disk results from averaged optical properties. This motivates for adopting a grain model that results from an ensemble of particles with similar geometric properties. The spherical grain model with voids satisfies this task, if the voids are distributed uniformly over the volume and thus the grain orientation is negligible.
Porosity is the ratio of the vacuum volume to the total volume of the grain, ![Mathematical equation: \begin{eqnarray} \mathcal{P}&=&V_{\textup{vacuum}}/V_{\textup{total}}=1-V_{\textup{solid}}/V_{\textup{total}},\\ \mathcal{P}&\in&\left[0,1\right].\nonumber \end{eqnarray}](/articles/aa/full_html/2013/04/aa20486-12/aa20486-12-eq5.png) (1)For example, a compact sphere is given for
(1)For example, a compact sphere is given for  . The radius a is denoted as the minimum radius of a sphere that encases the grain.
Two grains with equal radius and porosity can have fundamentally different hole sizes, considering the examples of a hollow sphere and a grain that contains many small holes. In principle, holes of different sizes can be assumed within a grain. Voshchinnikov et al. (2005) adopted a size distribution of the holes in their model, in which the probability of the presence of a hole is assumed to be inversely proportional to its volume. The holes in our grain model are determined both by the number of dipoles and the process of the grain generation (Sect. 2.3).
2.2. DDSCAT
We used the program DDSCAT to calculate the scattering and absorption cross sections of irregular particles (Draine & Flatau 1994, 2010). It is based on the theory of discrete dipole approximation (DDA), where a continuous particle is approximated by the corresponding spatial distribution of N discrete polarizable points on a cubic lattice. The great advantage of the DDA is the high flexibility of the particle structure, but the applicability is limited by the conditions that the lattice constant dl must be small compared to the wavelength and to the scales of the internal grain structure. The first condition is roughly expressed by (Draine & Goodman 1993; Draine & Flatau 1994 and Draine 2000)  (2)where n is the complex refractive index and k = 2π/λ the circular wavenumber. This criterion is satisfied for | n − 1 | ≲ 3 (Draine & Flatau 2010). With the volume of the material in the particle,
  , it follows
  , and thus with condition 2
 (3)For our studies we use astronomical silicate (Draine 2003b,c) with a bulk density of ρ = 3.5 g cm-3 (Draine 2003a).
Before applying the DDSCAT to investigate the behavior of porous grains, we verified the optimum parameter settings (number of dipoles used, etc.) in the case of compact spherical grains. Therefore, we calculate the absorption cross section with the DDSCAT and compare the results with absorption cross sections i) calculated via Mie theory and ii) using the DDSCAT with a number of dipoles decreased by a factor of 2. The results are summarized in Appendix A.
In Fig. 1 the applicability of the DDSCAT is illustrated for a compact spherical grain, represented by ~500 000 dipoles. According to condition 3, the DDSCAT delivers suitable results for the area below the solid line. While for the solid line the refractive index of the silicate is taken into account, the crosses are derived by the tests with the compact grains (Appendix A). These crosses mark the used upper limit of applicability.
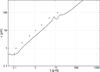 |
Fig. 1 Limit of the applicability of the DDSCAT for a compact spherical grain of astronomical silicate, represented by ~500 000 dipoles. According to condition 3, the DDSCAT delivers suitable results for particles with radius |
2.3. Generating porous grains
We briefly describe the process of generating porous model grains: N′ = 519 832 dipoles are arranged on a cubic lattice, forming the shape of a compact sphere. A random number generator is used to remove single dipoles to create grains with a porosity  . The remaining dipole arrangement contains
  dipoles, forming a sphere with voids. Each dipole represents a cubic subvolume (dl)3 of the surrounding material, while a removed dipole represents a cubic void of the same size. The large number of dipoles and the application of the random generator ensure a statistical distribution of the holes. Thus, no preferential direction exists and the optical properties are roughly independent of the grain orientation. The number of dipoles for the particles used in this paper are listed in Table 1. The particle cross sections are shown for different porosities in Fig. 2. Some dipoles seem to be detached from the rest of the complex, but it should be considered that these dipoles may be connected to the particle in the direction perpendicular to the presented cross section. Nevertheless, the procedure of particle generation does not prevent the occurrence of single dipoles, which are isolated from the rest of the configuration. For
  the statistical number of isolated dipoles is negligible if compared to the number of dipoles of the entire grain, but this number rises sharply with porosity. Therefore, only particles with porosities up to
  are considered in this paper.
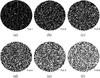 |
Fig. 2 Particle cross sections through the middle of the grain for porosities from |
Number N of dipoles for particles with porosity .
2.4. β-ratio and blowout size
We imagine a spherical grain in the orbit of a central star that is attracted by stellar gravitation and repelled by the radiation force. With decreasing radius, the radiation force becomes increasingly important. As a consequence, there is a minimum particle radius aBO, called blowout size, at which the particle is blown out of the system and which can be calculated as a function of the grains’ optical properties, the stellar luminosity L∗, and stellar mass M∗ (Burns et al. 1979; Artymowicz 1988). By modeling the density and grain size distribution of debris disks, a minimum grain radius is derived, which is often significantly above (a factor of ~2 up to one magnitude in some cases) the value calculated under the assumption of compact grains (e.g. HD 104860, HD 8907, HD 377, HD 107146, HD 61005, HD 191089; Roccatagliata et al. 2009; Ertel et al. 2011). Despite model degeneracies, particularly between minimum grain sizes and inner disk radii, there have been several attempts to explain this discrepancy. A more detailed grain size distribution, derived in collisional evolution studies of debris disks and resulting in an overdensity of small particles (Thébault et al. 2003; Krivov et al. 2006, 2008), can explain a factor of two. Grain segregation (Roccatagliata et al. 2009) or the occurrence of ice (Greenberg & Hage 1990) affect the value of the blowout size as well (Augereau et al. 2001). However, another possible explanation for this problem can be the nature of the porous particles, which requires more investigations, since porosity influences the scattering and absorption properties of the particles (Voshchinnikov & Mathis 1999; Voshchinnikov et al. 2005, 2006).
Physical properties of main sequence stars (Binney & Merrifield 1998) and respective stellar constant C∗ (see text for details).
2.4.1. Expression for the β-ratio
We now derive an expression for the β-ratio, the ratio of radiation (Frad) to gravitational force (Fgra),  (4)Under the assumption of an optically thin disk, the resulting radiation force is given by
  (5)(Köhler & Mann 2002, 2004) where the star is considered as a black body with effective temperature T∗, radius R∗ and mass M∗. The quantity Bλ(T∗) is the Planck function, c is the speed of light, and Qpr(λ) is the wavelength-dependent efficiency factor of the radiation pressure,
  (6)which is a function of the absorption (Qabs = Cabs/(πa2)) and scattering cross section (Qsca = Csca/(πa2)), and the asymmetry factor g. For a given grain mass
  the gravitational force on the particle amounts to
  (7)where γ is the gravitational constant. Using the Eqs. (4), (5) and (7) delivers
  (8)with
  (9)For the Sun one thus derives C∗ = C⊙ = 2.865 × 10⁻¹¹ s3 m-2. The quantity C∗ is a function of stellar parameters alone, while the other factors in front of the integral in Eq. (8) represent the dust properties. The integral reflects the interaction between dust and star. In Table 2, the factor C∗ is presented for main sequence stars of spectral type A to K. The stellar parameters are taken from Binney & Merrifield (1998), as published in Schmidt-Kaler (1982).
The particle is ejected from the system, if β(a) > 1/2. A particle that initially moves on a circular orbit is compelled on an elliptic orbit for β < 0.5. The trajectory is parabolic (hyperbolic) for β = 0.5( > 0.5), and the particle leaves the system (Krivov et al. 2006).
We would like to remind the reader that in the literature (see Burns et al. 1979; Artymowicz 1988; Krügel 2003; Hahn 2010) an approximation equation is usually given that neglects the wavelength dependence of Qpr. In the limit of the geometrical optics, Qpr is equal to 1, resulting in  (10)Equation (10) is easy to handle and therefore suitable for a rough estimation of the blowout size. However, for more precise studies (as required in our investigations) the wavelength dependence of Qpr expressed in Eq. (8) must be considered.
2.4.2. Previous studies
The influence of porosity on the radiation pressure has already been considered in previous studies. Mukai et al. (1992), Kimura et al. (1997), and Köhler et al. (2007) have examined porous aggregates with fractal structures, ballistic particle-cluster aggregates (BPCA), and ballistic cluster-cluster aggregates (BCCA), which are described in terms of the fractal dimension (e.g. Witten & Cates 1986). These aggregates are two extreme cases of relatively compact and highly porous aggregates, whereas we apply a grain model that allows us to increase the porosity step by step, permitting an analysis of the physical dust properties with changing porosity. Mukai et al. (1992) investigated the β-ratio based on Maxwell Garnett effective medium theory (Maxwell Garnett 1904), and Kimura et al. (1997) used the Bruggeman rule (Bruggeman 1935). Hage & Greenberg (1990) assessed the accuracy of Qabs when determined with Maxwell Garnett, while Bazell & Dwek (1990) report a discrepancy at longer wavelengths. Voshchinnikov & Mathis (1999) found that effective medium theories are considerably worse for calculating scattering cross sections and the asymmetry factor g than for extinction cross sections.
In Köhler et al. (2006, 2007) the DDA is applied to simulate light scattering by irregular aggregates. They calculated the optical properties of larger grains only for one wavelength (λ = 0.6 μm) and thus neglect the wavelength dependence of Qpr. In our study the number of dipoles is much larger, which allows us to calculate the optical properties for a wide wavelength range and for grains up to a = 4 μm. We then use the obtained data to investigate not only the β-ratio, but also the blowout size for various porosities, stellar temperatures, and number of dipoles, and simultaneously calculate the dust temperature of porous grains, especially the one of the blowout grains. This gives a comprehensive overview of porous grains in debris disks.
3. Results for the efficiency factor of absorption
The β-ratio of a dust grain is a function of the optical properties. The simulation software DDSCAT delivers the quantities Qabs, Qsca, and g for each wavelength and radius, therefore we investigate the absorption cross sections for porous particles with radius a = 1 μm (upper image of Fig. 3). The porosity varies in steps of 0.1 from  to 0.6. To emphasize the dependence on porosity, the curves are normalized to the values of compact spheres (Qabs,0) in the bottom image of Fig. 3. The relative differences of Qabs increase with porosity for all wavelengths lower than 25 μm. Qabs drops with increasing porosity for wavelengths from 0.2 to 25 μm and increases for λ < 0.2 μm. For λ > 50 μm, Qabs increases with porosity up to
  and then decreases again. The values for the porosity
  are 0.21 to 1.13 times larger than the ones for compact spheres. Around λ ~ 1 μm, the curves have a wavy pattern, which diminishes with increasing porosity.
Furthermore, we calculated the absorption cross sections of the same grain with an effective medium theory (Fig. 5), using the Bruggeman rule (Bruggeman 1935). Besides the main similarity of both figures, the main differences are found for λ < 0.2 μm and λ > 20 μm. The values for the porosity are 0.25 to 1.2 times larger than the ones for compact spheres. In addition, the wavy pattern around λ ~ 1 μm is more pronounced and can be detected also for  .
.
4. Blowout size for different parameter
We determine the blowout size as a function of the porosity and the stellar luminosity.
Blowout size as a function of grain porosity in the solar system.
4.1. Blowout size for porous particles in the solar system
At first we investigate the impact of grain porosity on the blowout size of the solar system. For this purpose, the β-distributions of compact spheres and porous particles are determined. The effective temperature of the Sun is T∗ = 5777 K, and the porosity varies in steps of 0.1 from to 0.6. The distributions are presented in Fig. 4, and the corresponding blowout sizes are listed in Table 3.
-
1.
The β-value strongly increases with radius, reaching a maximum, and then starts falling off. With increasing porosity, the maximum of the β-distribution decreases and shifts towards larger radii. Thus, the maximum is the largest for compact spheres. Furthermore, the slope at the larger radii becomes flatter.
-
2.
The blowout size of compact spheres is aBO = 0.46 μm. For comparison, the value 0.33 μm is obtained with the approximation Eq. (10). In Mukai et al. (1992) a blowout size between 0.3 μm and 0.35 μm can be estimated, and in Köhler & Mann (2002) between 0.45 μm and 0.5 μm (see paper, Figs. 4b and 1, resp.).
-
3.
The higher the porosity, the larger the blowout size. For
 the blowout size is aBO = 0.84 μm, 1.8 times larger than for
  . This factor is comparable to the factor between the minimum grain size obtained with disk modeling and the value calculated under the assumption of compact spheres.
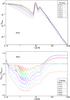 |
Fig. 3 Wavelength-dependent absorption cross section Qabs as a function of porosity |
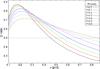 |
Fig. 4 The β-ratio as a function of the grain radius a and porosity |
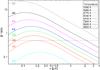 |
Fig. 6 The β-ratio as a function of the grain radius a for stars of various spectral type (different stellar temperature). The particles are compact spheres. |
4.2. Blowout size of stars of various spectral type
The influence of different stellar luminosities on the blowout size is investigated. For this purpose, we consider compact spherical grains with particle radii up to 4 μm, since higher luminosities increase the radiation force and thus the blowout size. The values for T∗ and C∗ for the eight different spectral types from K0 to A5 are summarized in Table 2. The resulting β-distributions are shown in Fig. 6.
-
1.
The higher the luminosity, the higher the β-values, whereby the blowout size increases. In addition, the maximum of the β-distribution shifts to smaller particle radii for higher luminosities.
-
2.
For some luminosities one finds β < 0.5 for all particle radii, so there no blowout size exists in these systems. In particular, only stars with temperatures T∗ > 5250 K have a blowout size. There is also no blowout size at lower temperatures for porous grains, since the maximum of the β-distribution is the greatest for compact spheres, and it decreases with increasing porosity (Sect. 4.1).
-
3.
The blowout size at T∗ = 9520 K is larger than 4 μm, and even higher values are expected for porous particles. Calculations of the optical properties of such large grains exceed our computational capabilities, therefore stars with T∗ ≥ 9520 K are not investigated further.
-
4.
Several temperature curves intersect the 0.5 limit in the examined particle radii interval even twice, whereby two values for the blowout size exist (e.g. the T∗ = 5770 K curve). Further forces are acting on very small particles, such as the Poynting-Robertson effect and the Lorentz force, which are negligible for larger grains, but have to be taken into account for the balance of forces on very small grains (Grün et al. 2001).
4.3. Parameter space
As shown in the previous two sections, the blowout size depends on both the grain porosity and the stellar temperature. We now determine the blowout size for each parameter configuration. The computational effort is large, especially particles with radii a > 2 μm increase the calculation time dramatically. We generate and evaluate the data for the following parameter space:
-
seven porosities:
 , 0.1, 0.2, 0.3, 0.4, 0.5, and 0.6,
 -
five stellar temperatures: T∗ = 5770 K, 6030 K, 6440 K, 7200 K, and 8200 K,
-
six number of dipoles, from 54,432 to 519,832 dipoles.
We vary the total number of dipoles and thus the size of the inner voids to investigate the influence of different particle structures. The calculated blowout sizes of the special particle presented in Sect. 2.3 are illustrated in Fig. 7 and listed in Table 4. Missing table entries imply a blowout size larger than 4 μm and are thus not computable within the parameter settings.
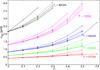 |
Fig. 7 Blowout size aBO as a function of porosity |
Figure 7 again reveals the blowout size increasing both with grain porosity and stellar temperature. For T∗ = 5770 K the blowout size of porous grains ( ) is larger by a factor of 1.5 if compared to compact spheres. The higher the temperature, the stronger the effect, so that the factor amounts to 2.8 for T∗ = 7200 K. These factors are close to matching the existing discrepancy mentioned in Sect. 2.4. The variation in the number of dipoles causes a dispersion of the blowout sizes. This dispersion increases also both with and T∗. In most cases, aBO rises with decreasing number of dipoles. However, there are exceptions. The largest deviations from the other calculated blowout sizes occur for the lowest number of dipoles, the coarsest particles, whose aBO are significantly larger than those from the other ones (triple dotted lines).
Figure 7 can be used to estimate the blowout size for a given grain porosity  and stellar temperature T∗. The different blowout sizes at constant porosity and temperature, caused by the varying number of dipoles, set the range of applicability in which the blowout size can be found.
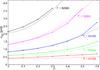 |
Fig. 8 Calculated blowout sizes (solid line) and derived approximation function (dotted lines). Using the equation, it is possible to estimate aBO as a function of grain porosity and stellar temperature. |
Blowout size in μm as a function of grain porosity and stellar temperature T∗.
4.4. Fitting model
In this section an approximation function  ) for the blowout size is derived. We find that the results of the special particle presented in Sect. 2.3 can be analytically approximated very well using the following equation:
 ![Mathematical equation: \begin{eqnarray} &&a_{\mathrm{BO}}\left(\mathcal{P},\,T_*\right)=(k_1 T_*+k_2) \cdot \mathcal{P}^{\alpha}\,+\,\left(k_3 T_*+k_4\right), \label{GlFit}\\[0.3cm] &&k_1=5.07\times 10^{-3}{\frac{~\mu m}{K}},\quad k_2=-28.85~\mu{\rm m},\nonumber\\[2mm] &&k_3=7.01\times 10^{-4}{\frac{~\mu m}{K}},\quad k_4=\enspace-3.65~\mu{\rm m},\nonumber\\[2mm] &&\alpha=1.781-\frac{61.72\,\mathrm{K}}{T_*\,-\,5670\, \mathrm{K}}\cdot\nonumber \end{eqnarray}](/articles/aa/full_html/2013/04/aa20486-12/aa20486-12-eq199.png) (11)It contains seven coefficients (three for α, and the ki, i ∈ N≤ 4).
(11)It contains seven coefficients (three for α, and the ki, i ∈ N≤ 4).
The fit is presented in Fig. 8. The relative deviation between fit and measured values is for the highest temperature lower than 8%, so Eq. (11) is a good way to estimate the size of the blowout. An online tool for calculating the blowout size based on this approximation function is available online1.
4.5. β influenced by other effects
We discuss other possible effects which might influence the β-ratio.
4.5.1. Particle modeling
The particles used in this paper have a spherical shape, into which holes are formed. Besides prolate and oblate shapes, real particles can have a much more complex non symmetric structure. However, the vast variety of particle shapes cannot be examined. The spherical shape with inclusions was chosen as representative of all porous and arbitrary shaped particles.
It should be noted that large particles are generally more porous than smaller ones, because they can be seen as agglomerates of smaller subunits. Lamy et al. (1987) modeled the density of small grains by ρ = 2.2−1.4 (a2 + a), where a is in μm and ρ in g cm-3. With increasing particle radius this density law leads to higher β-values.
There is no unique definition of the optical properties and bulk densities of what is considered as an “astronomical silicate“. As the β-ratio is inverse to the density, the choice of ρ has a strong impact on the blowout size. It is also conceivable that individual particles consist of several materials.
The mentioned points do not lead to errors in the calculations. Instead, they show the possible complexity and variety of particles in the disk, hence the difficulty in specifying the blowout size of a stellar system, since a separate β-value can be allocated to each particle and even to each particle orientation.
4.5.2. Central star
The stellar component is considered as a black body with the effective temperature T∗. In contrast to this, Lamy (1974) and Artymowicz (1988) motivated to use an observed or a modeled photospheric spectrum (e.g. Kurucz model). We did not consider this in our parameter space study because fundamentals are first investigated. In the treatment of a real object, the shape of the spectrum should be used. Furthermore, C∗ is calculated for parameters of a main-sequence star model. Real stars can deviate from these values, so real values should be used for stellar mass and radius if available.
4.5.3. Ejection limit
The ejection limit βejection = 0.5 only applies to particles that have been produced by planetesimals that move in circular orbits, i.e. for which the orbit eccentricity is e = 0.0. The general β threshold depends on the position Φ of the elliptical orbit, where the particle is set free, and is 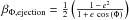 . Even eccentricities as low as e = 0.1 can cause β-values from 0.45 to 0.55. Owing to the different ejection conditions for each particle, the blowout size depends on the eccentricity. This influence is quite strong compared to the other effects discussed above.
4.5.4. Further forces acting on dust grains in debris disks
The derivation of Eq. (8) for β only considers gravitational and radiation forces. In addition, the Poynting-Robertson effect and stellar wind drags are acting on the particles, and in the case of charged particles also the Lorentz force. The magnitude of these forces depends strongly on the particle size. The gravitational force dominates for particles with radii a > 1 μm. For particles with radii 0.05 μm or lower, the Lorentz force prevails. For intermediate particle radii, the radiation force is important beside gravitation and Lorentz force. In Grün (1999), the various forces are listed and compared for different particle radii.
5. Dust temperature of fluffy grains
Finally, the influence of porosity on the dust equilibrium temperature is investigated. For this purpose the dust temperature Tg is determined if the grains are only heated by direct stellar radiation. When taking the energy conservation into account, the distance r of the particle from the star is 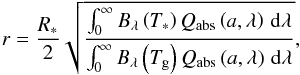 (12)(Wolf & Hillenbrand 2003). We calculated the dust temperature at a distance of r = 50 AU for stellar temperatures T∗ = 5770 K and T∗ = 7200 K and illustrate them in Figs. 9 and 10, respectively.
- 1.
The temperature of the smallest particles increases with the grain radius up to a maximum before it falls off steeply for larger radii. In addition, the maximum shifts with increasing porosity from 0.28 μm for
to 0.5 μm for in the case of T∗ = 5770 K, and from 0.24 μm for to 0.43 μm for in the case of T∗ = 7200 K. - 2.
For particles with radii 0.03 μm < a < 1.2 μm the following is valid. The higher the porosity, the colder is the particle. For a fixed radius, the drop in temperature decreases with increasing porosity. For
and radii a < 0.03 μm, the temperature is even higher than for corresponding radii at  .
. - 3.
The blowout sizes as calculated in Sect. 4.3 are marked in the figures and reveal that most of the presented dust particles will be blown out of the system.
, the dust temperature is 22 K below the one for . At 100 AU this difference is 9.2 K.
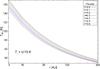 |
Fig. 11 Dust temperature of the blowout size grains TBO as a function of porosity |
Voshchinnikov et al. (2006) determined the dust temperature for porous particles using the effective medium theory once and the method of layered spheres once. The material was a mixture of astronomical silicate (Laor & Draine 1993) and amorphous carbon (Rouleau & Martin 1991) with a weighting of 1:1. Comparing our grain model with the studies from Voshchinnikov et al. (2006), we furthermore calculated the dust temperature for a mixture of astronomical silicate and amorphous carbon, which is presented in Fig. 12 as a function of the effective radius, . The central star has an effective temperature of T∗ = 2500 K, and the assumed grain distance is r = 104 R∗.
The results of Voshchinnikov et al. (2006) are comparable to the ones calculated with the DDA. For the layered spheres the temperature decreases with increasing porosity. This statement applies to the EMT only up to a porosity of  , when the temperature increases again. The decrease in temperature for lower porosities can also be observed in our approach. Greenberg & Hage (1990) ascertained in their studies the increasing of temperature at very high porosities, where the temperature approaches the value of subunits of the porous particle. Certainly the behavior differs for the lower porosities, since the temperature remains constant or increases slightly. Voshchinnikov et al. (2006) have also performed investigations for different stellar temperatures and distances and found the same behavior. For high porosities, the differences between the method of layered spheres and the EMT could reach ~15%, and for compact grains they were less than 1%.
In conclusion, porous particles with radii up to 1.3 μm are generally colder than compact spheres, and the maximum of the infrared emission is thus shifted to longer wavelengths. Our results agree very well with those of Voshchinnikov et al. (2006).
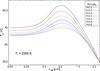 |
Fig. 12 Dust temperature Tg at the distance of 104 stellar radii from a star with effective temperature T∗ = 2500 K, depending on the porosity and the effective radius . The dust material is a 1:1 mixture of astronomical silicate and amorphous carbon. |
6. Conclusions
When modeling the density and grain size distribution in debris disks, the minimum particle size is often significantly larger than the corresponding blowout size. We investigated porous dust grains, which provide a possible explanation. Since the introduced β-ratio depends on the optical properties of the grain, we determined the absorption cross sections of porous particles as a function of the porosity. The blowout sizes of six different sample stars and seven porosities (including compact spheres) were calculated. We found that the blowout size increases with grain porosity and stellar temperature. It should be noted that both the choice of the bulk density, as well as the particle ejection limit, has a strong influence on the obtained results. An approximation equation was derived from the numerically calculated values with which the blowout size can be estimated. Finally, the dependence of the dust temperature on particle radius and porosity was investigated. It was found that porous particles are colder than compact spheres, and the temperature of blowout grains in particular decreases for porous particles.
The optical properties of porous particles were determined with the DDSCAT for an extended range of wavelengths and particle radii. These efficiency factors of absorption, scattering, and radiation pressure are summarized in several tables and are available for further applications. An online tool for calculating the blowout size based on the derived approximation function is available online2.
Acknowledgments
We would like to thank Steve Ertel for a helpful discussion. F.K. thanks the DFG for financial support under contract WO 857/7-1.
References
- Acke, B., Min, M., Dominik, C., et al. 2012, A&A, 540, A125 [NASA ADS] [CrossRef] [EDP Sciences] [Google Scholar]
- Artymowicz, P. 1988, ApJ, 335, L79 [NASA ADS] [CrossRef] [Google Scholar]
- Augereau, J. C., Lagrange, A. M., Mouillet, D., Papaloizou, J. C. B., & Grorod, P. A. 1999, A&A, 348, 557 [NASA ADS] [Google Scholar]
- Augereau, J. C., Nelson, R. P., Lagrange, A. M., Papaloizou, J. C. B., & Mouillet, D. 2001, A&A, 370, 447 [NASA ADS] [CrossRef] [EDP Sciences] [Google Scholar]
- Bazell, D., & Dwek, E. 1990, ApJ, 360, 142 [NASA ADS] [CrossRef] [Google Scholar]
- Binney, J., & Merrifield, M. 1998, Galactic Astronomy (Princeton, NJ: Princeton University Press) [Google Scholar]
- Birnstiel, T., Ricci, L., Trotta, F., et al. 2010, A&A, 516, L14 [NASA ADS] [CrossRef] [EDP Sciences] [Google Scholar]
- Blum, J., & Wurm, G. 2008, ARA&A, 46, 21 [NASA ADS] [CrossRef] [EDP Sciences] [Google Scholar]
- Bruggeman, D. A. G. 1935, Ann. Phys., 416, 636 [NASA ADS] [CrossRef] [Google Scholar]
- Burns, J. A., Lamy, P. L., & Soter, S. 1979, Icarus, 40, 1 [NASA ADS] [CrossRef] [Google Scholar]
- Demyk, K., Jones, A. P., Dartois, E., Cox, P., & D’Hendecourt, L. 1999, A&A, 349, 267 [NASA ADS] [Google Scholar]
- Draine, B. T. 2000, in The Discrete Dipole Approximation for Light Scattering by Irregular Targets, eds. M. I. Mishchenko, J. W. Hovenier, & L. D. Travis, 131 [Google Scholar]
- Draine, B. T. 2003a, ARA&A, 41, 241 [NASA ADS] [CrossRef] [Google Scholar]
- Draine, B. T. 2003b, ApJ, 598, 1017 [NASA ADS] [CrossRef] [Google Scholar]
- Draine, B. T. 2003c, ApJ, 598, 1026 [NASA ADS] [CrossRef] [Google Scholar]
- Draine, B. T., & Flatau, P. J. 1994, J. Opt. Soc. Am. A, 11, 1491 [NASA ADS] [CrossRef] [Google Scholar]
- Draine, B. T., & Flatau, P. J. 2010 [arXiv:1002.1505] [Google Scholar]
- Draine, B. T., & Goodman, J. 1993, ApJ, 405, 685 [NASA ADS] [CrossRef] [Google Scholar]
- Ertel, S., Wolf, S., Metchev, S., et al. 2011, A&A, 533, A132 [NASA ADS] [CrossRef] [EDP Sciences] [Google Scholar]
- Ertel, S., Wolf, S., & Rodmann, J. 2012, A&A, 544, A61 [NASA ADS] [CrossRef] [EDP Sciences] [Google Scholar]
- Fitzgerald, M. P., Kalas, P. G., Duchêne, G., Pinte, C., & Graham, J. R. 2007, ApJ, 670, 536 [NASA ADS] [CrossRef] [Google Scholar]
- Greenberg, J. M., & Hage, J. I. 1990, ApJ, 361, 260 [NASA ADS] [CrossRef] [Google Scholar]
- Grün, E. 1999, Interplanetary Dust and the Zodiacal Cloud, 673 [Google Scholar]
- Grün, E., Gustafson, B., Dermott, S., & Fechtig, H. E. 2001, in Interplanetary Dust, Astron. Astrophys. Lib. (Springer), 804 [Google Scholar]
- Hage, J. I., & Greenberg, J. M. 1990, ApJ, 361, 251 [NASA ADS] [CrossRef] [Google Scholar]
- Hahn, J. M. 2010, ApJ, 719, 1699 [NASA ADS] [CrossRef] [Google Scholar]
- Kimura, H., Ishimoto, H., & Mukai, T. 1997, A&A, 326, 263 [NASA ADS] [Google Scholar]
- Köhler, M., & Mann, I. 2002, Proc. Asteroids, Comets, Meteors – ACM, 500, 771 [Google Scholar]
- Köhler, M., & Mann, I. 2004, J. Quant. Spect. Rad. Transf., 89, 453 [Google Scholar]
- Köhler, M., Kimura, H., & Mann, I. 2006, A&A, 448, 395 [NASA ADS] [CrossRef] [EDP Sciences] [Google Scholar]
- Köhler, M., Minato, T., Kimura, H., & Mann, I. 2007, Adv. Space Res., 40, 266 [NASA ADS] [CrossRef] [Google Scholar]
- Krivov, A. V., Löhne, T., & Sremčević, M. 2006, A&A, 455, 509 [NASA ADS] [CrossRef] [EDP Sciences] [Google Scholar]
- Krivov, A. V., Müller, S., Löhne, T., & Mutschke, H. 2008, ApJ, 687, 608 [NASA ADS] [CrossRef] [Google Scholar]
- Krügel, E. 2003, in The physics of interstellar dust, IoP Series in Astronomy and Astrophysics (Bristol, UK: The Institute of Physics) [Google Scholar]
- Lamy, P. L. 1974, A&A, 35, 197 [NASA ADS] [Google Scholar]
- Lamy, P. L., Gruen, E., & Perrin, J. M. 1987, A&A, 187, 767 [NASA ADS] [Google Scholar]
- Laor, A., & Draine, B. T. 1993, ApJ, 402, 441 [NASA ADS] [CrossRef] [Google Scholar]
- Maxwell Garnett, J. C. 1904, Roy. Soc. London Philos. Trans. Ser. A, 203, 385 [Google Scholar]
- Mie, G. 1908, Ann. Phys., 330, 377 [Google Scholar]
- Min, M., Hovenier, J. W., & de Koter, A. 2005, A&A, 432, 909 [NASA ADS] [CrossRef] [EDP Sciences] [Google Scholar]
- Mukai, T., Ishimoto, H., Kozasa, T., Blum, J., & Greenberg, J. M. 1992, Ann. Rev. Astron. Astrophys., 262, 315 [Google Scholar]
- Pinte, C., Padgett, D. L., Ménard, F., et al. 2008, A&A, 489, 633 [NASA ADS] [CrossRef] [EDP Sciences] [Google Scholar]
- Ricci, L., Testi, L., Natta, A., et al. 2010, A&A, 512, A15 [NASA ADS] [CrossRef] [EDP Sciences] [Google Scholar]
- Ricci, L., Trotta, F., Testi, L., et al. 2012, A&A, 540, A6 [NASA ADS] [CrossRef] [EDP Sciences] [Google Scholar]
- Roccatagliata, V., Henning, T., Wolf, S., et al. 2009, A&A, 497, 409 [NASA ADS] [CrossRef] [EDP Sciences] [Google Scholar]
- Rouleau, F., & Martin, P. G. 1991, ApJ, 377, 526 [NASA ADS] [CrossRef] [Google Scholar]
- Schmidt-Kaler, T. 1982, Landolt-Bornstein Numerical Data and Functional Relationships and Technology, 2 [Google Scholar]
- Semenov, D., Henning, T., Helling, C., Ilgner, M., & Sedlmayr, E. 2003, A&A, 410, 611 [NASA ADS] [CrossRef] [EDP Sciences] [Google Scholar]
- Thébault, P., Augereau, J. C., & Beust, H. 2003, A&A, 408, 775 [NASA ADS] [CrossRef] [EDP Sciences] [Google Scholar]
- van Breemen, J. M., Min, M., Chiar, J. E., et al. 2011, A&A, 526, A152 [NASA ADS] [CrossRef] [EDP Sciences] [Google Scholar]
- Voshchinnikov, N. V., & Mathis, J. S. 1999, ApJ, 526, 257 [NASA ADS] [CrossRef] [Google Scholar]
- Voshchinnikov, N. V., Il’in, V. B., & Henning, T. 2005, A&A, 429 [Google Scholar]
- Voshchinnikov, N. V., Il’in, V. B., Henning, T., & Dubkova, D. N. 2006, A&A, 445, 167 [NASA ADS] [CrossRef] [EDP Sciences] [Google Scholar]
- Witten, T. A., & Cates, M. E. 1986, Science, 232, 1607 [NASA ADS] [CrossRef] [Google Scholar]
- Wolf, S., & Hillenbrand, L. A. 2003, ApJ, 596, 603 [NASA ADS] [CrossRef] [Google Scholar]
- Wolf, S., & Voshchinnikov, N. V. 2004, Comput. Phys. Comm., 162, 113 [CrossRef] [Google Scholar]
- Wyatt, M. C., & Dent, W. R. F. 2002, MNRAS, 334, 589 [NASA ADS] [CrossRef] [Google Scholar]
- Yurkin, M. A., Min, M., & Hoekstra, A. G. 2010, Phys. Rev. E, 82, 036703 [NASA ADS] [CrossRef] [Google Scholar]
Appendix A: Tests with compact grains
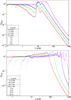 |
Fig. A.1 Absorption cross section Qabs derived with DDA (crosses) and Mie (solid lines) as a function of the wavelength. The particles are compact spheres with radii a from 0.5 to 5.0 μm (above) and 10.0 to 100.0 μm (bottom). |
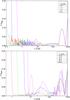 |
Fig. A.2 Relative deviations of the absorption cross sections derived with DDA and Mie, Δqabs = | (Qabs − Qabs,Mie)/Qabs,Mie |. The particles are compact spheres with radii a from 0.5 to 5.0 μm (above) and 10.0 to 100.0 μm (bottom). |
Appendix A.1: Comparison Mie theory and DDA
We use the program miex (Wolf & Voshchinnikov 2004) to calculate the absorption cross sections based on Mie scattering and compare them with DDA results. Eight grain radii from 0.5 to 100 μm and 200 wavelengths from 0.1 to 1000 μm are examined (Fig. A.1). With an increasing size parameter, the DDSCAT computing time increases, and the results become highly inaccurate, depending on the chosen number of dipoles, in our case 519,832. In Fig. A.2 the relative deviations of the results of DDA (Qabs) and Mie (Qabs,Mie) are presented, Δqabs = | (Qabs − Qabs,Mie)/Qabs,Mie|. One can see in Fig. A.1 that at short wavelengths the DDA values are significantly below the Mie ones. Thus these results are neglected, exceeding the limits of the DDA, and there is a lower limit of the wavelengths λmin for which at all wavelengths λ > λmin follows: Δqabs(λ) < 5%. Here, λmin increases with the grain size a (Table A.1). The limit of applicability can be raised by increasing the number of dipoles, resulting in an increase in the calculation time as well.
Smallest wavelength λmin, at which the relative deviations of the DDA and Mie results are not larger than 5%.
In conclusion, to calculate absorption coefficients for wavelengths shorter than 0.5 μm, the DDA can be applied within our parameter settings for grains with radii a ≤ 5 μm. Despite these limitations, the similarities of both approaches are remarkably good.
Appendix A.2: Decreased number of dipoles
The convergence of DDA depends on the particle shape, and for compact spheres it is easier to reach convergence (Yurkin et al. 2010). To check the accuracy of the method we decrease the number of dipoles by a factor of 2 and compare the results. The decreased number of dipoles causes only small changes. The lower limit of the wavelengths λmin is slightly increased (Table A.2). These values mark the upper limit of applicability of the DDSCAT (Fig. 1). Besides that, the changes are negligible.
All Tables
Physical properties of main sequence stars (Binney & Merrifield 1998) and respective stellar constant C∗ (see text for details).
Smallest wavelength λmin, at which the relative deviations of the DDA and Mie results are not larger than 5%.
All Figures
|
Fig. 1 Limit of the applicability of the DDSCAT for a compact spherical grain of astronomical silicate, represented by ~500 000 dipoles. According to condition 3, the DDSCAT delivers suitable results for particles with radius |
| In the text | |
|
Fig. 2 Particle cross sections through the middle of the grain for porosities from |
| In the text | |
|
Fig. 3 Wavelength-dependent absorption cross section Qabs as a function of porosity |
| In the text | |
|
Fig. 4 The β-ratio as a function of the grain radius a and porosity |
| In the text | |
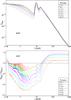 |
Fig. 5 Same as Fig. 3, but derived with effective medium theory (EMT, Bruggeman rule). |
| In the text | |
|
Fig. 6 The β-ratio as a function of the grain radius a for stars of various spectral type (different stellar temperature). The particles are compact spheres. |
| In the text | |
|
Fig. 7 Blowout size aBO as a function of porosity |
| In the text | |
|
Fig. 8 Calculated blowout sizes (solid line) and derived approximation function (dotted lines). Using the equation, it is possible to estimate aBO as a function of grain porosity and stellar temperature. |
| In the text | |
|
Fig. 11 Dust temperature of the blowout size grains TBO as a function of porosity |
| In the text | |
|
Fig. 12 Dust temperature Tg at the distance of 104 stellar radii from a star with effective temperature T∗ = 2500 K, depending on the porosity and the effective radius . The dust material is a 1:1 mixture of astronomical silicate and amorphous carbon. |
| In the text | |
|
Fig. A.1 Absorption cross section Qabs derived with DDA (crosses) and Mie (solid lines) as a function of the wavelength. The particles are compact spheres with radii a from 0.5 to 5.0 μm (above) and 10.0 to 100.0 μm (bottom). |
| In the text | |
|
Fig. A.2 Relative deviations of the absorption cross sections derived with DDA and Mie, Δqabs = | (Qabs − Qabs,Mie)/Qabs,Mie |. The particles are compact spheres with radii a from 0.5 to 5.0 μm (above) and 10.0 to 100.0 μm (bottom). |
| In the text | |
Current usage metrics show cumulative count of Article Views (full-text article views including HTML views, PDF and ePub downloads, according to the available data) and Abstracts Views on Vision4Press platform.
Data correspond to usage on the plateform after 2015. The current usage metrics is available 48-96 hours after online publication and is updated daily on week days.
Initial download of the metrics may take a while.