Fig. 5
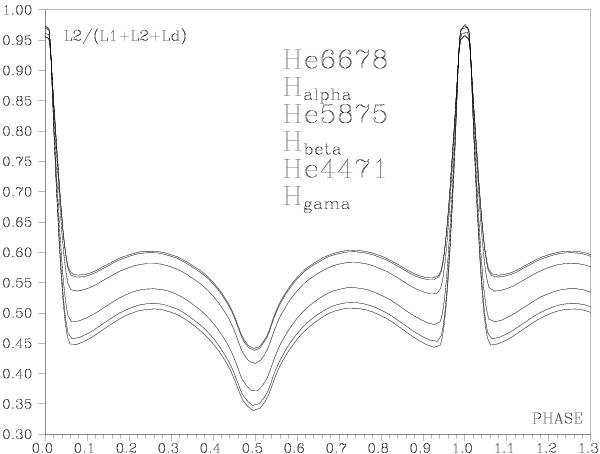
Donor light contribution with respect to the total light calculated from the light curve model. Each curve shows the donor contribution for a specific spectral range around a spectral line. The selected spectral lines (and ranges) are from top to the bottom: HeI 6678 Å, Hα, HeI 5875 Å, Hβ, HeI 4471 Å, and Hγ. L1 and L2 are the stellar fluxes and Ld is the disc contribution.
Current usage metrics show cumulative count of Article Views (full-text article views including HTML views, PDF and ePub downloads, according to the available data) and Abstracts Views on Vision4Press platform.
Data correspond to usage on the plateform after 2015. The current usage metrics is available 48-96 hours after online publication and is updated daily on week days.
Initial download of the metrics may take a while.