Free Access
Fig. B.1
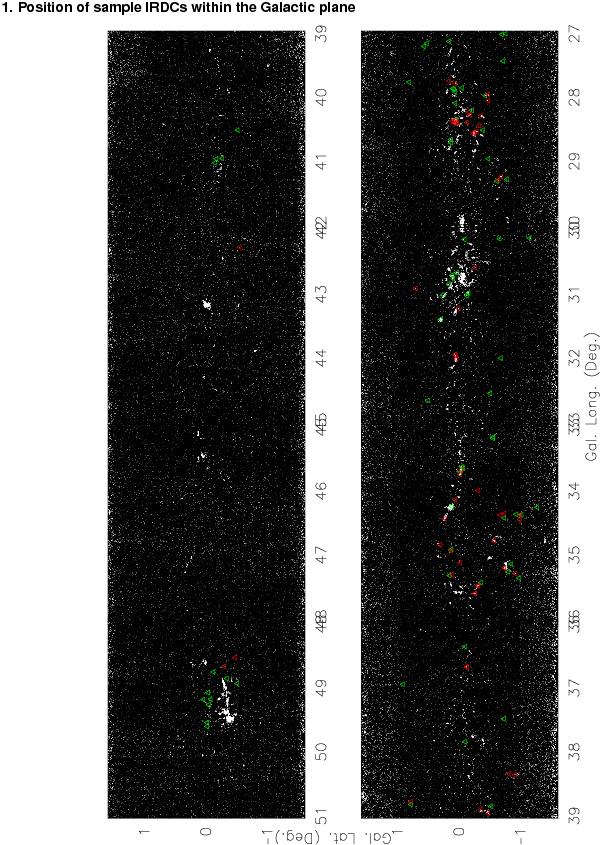
ATLASGAL dust emission map with indicated sample IRDCs in the range of l = 27° to 51° (Schuller et al. 2009). The red triangles indicate the IRDCs with detected ammonia lines, the green triangles the ones without detected ammonia lines.
Current usage metrics show cumulative count of Article Views (full-text article views including HTML views, PDF and ePub downloads, according to the available data) and Abstracts Views on Vision4Press platform.
Data correspond to usage on the plateform after 2015. The current usage metrics is available 48-96 hours after online publication and is updated daily on week days.
Initial download of the metrics may take a while.