Fig. 1
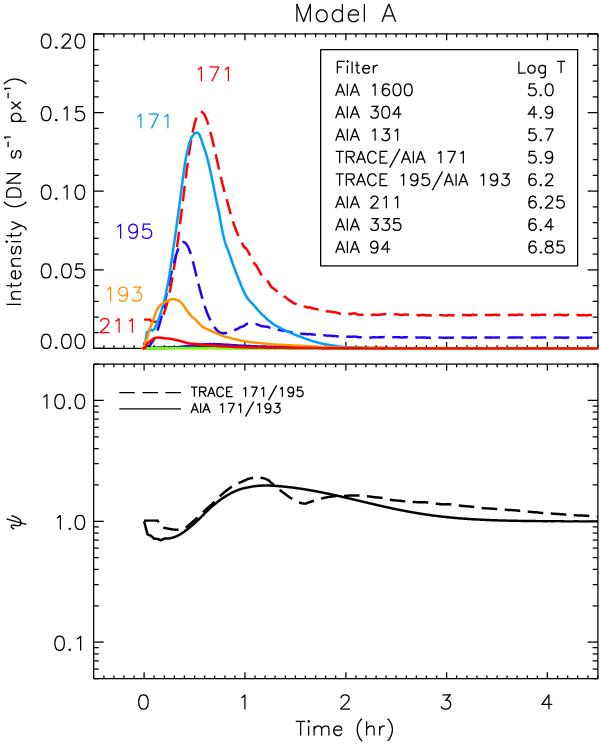
Synthesised TRACE and AIA intensities (top panel) and density excess factors (bottom panel) as functions of time from the start of the additional heating for model A. TRACE 171 and 195 curves are plotted with dashed lines, SDO/AIA curves with solid lines. The temperatures corresponding to the peaks of the response functions of TRACE and AIA filters are reported in the inset in the top panel.
Current usage metrics show cumulative count of Article Views (full-text article views including HTML views, PDF and ePub downloads, according to the available data) and Abstracts Views on Vision4Press platform.
Data correspond to usage on the plateform after 2015. The current usage metrics is available 48-96 hours after online publication and is updated daily on week days.
Initial download of the metrics may take a while.