| Issue |
A&A
Volume 551, March 2013
|
|
|---|---|---|
| Article Number | L10 | |
| Number of page(s) | 4 | |
| Section | Letters | |
| DOI | https://doi.org/10.1051/0004-6361/201321030 | |
| Published online | 26 February 2013 | |
Letter to the Editor
Discovery of collimated ejection from the symbiotic binary BF Cygni⋆
1
Astronomical Institute, Slovak Academy of Sciences,
059 60
Tatranská Lomnica,
Slovakia
e-mail: This email address is being protected from spambots. You need JavaScript enabled to view it.
2
Institute of Astronomy and NAO, Bulgarian Academy of
Sciences, PO Box
136, 4700
Smolyan,
Bulgaria
Received: 2 January 2013
Accepted: 29 January 2013
Abstract
Context. Detection of collimated ejection from white dwarfs (WD) in symbiotic binaries is very rare and has employed a variety of methods in X-ray, radio, optical imagery, and spectroscopy. To date, its signature in the optical spectra has only been recorded for four objects (MWC 560, Hen 3-1341, StHα 190, and Z And).
Aims. We present the first observational evidence of highly-collimated bipolar ejection from the symbiotic binary BF Cyg, which developed during its current (2006-12) active phase, and determine their physical parameters.
Methods. We monitored the outburst with the optical high-resolution spectroscopy and multicolour UBVRCIC photometry.
Results. During 2009, three years after the 2006-eruption of BF Cyg, satellite components to Hα and Hβ lines emerged in the spectrum. During 2012, they became stable and were located symmetrically with respect to the main emission core of the line. Spectral properties of these components suggest bipolar ejection collimated within an opening angle of ≲15°, whose radiation is produced by an optically thin medium with the emission measure of 1−2 × 1059 (d/3.8 kpc)2 cm-3.
Conclusions. Formation of the collimated ejection a few years after the eruption and its evolution on a time scale of years at a constant optical brightness can aid us in better understanding the accretion process during the active phases of symbiotic stars.
Key words: ISM: jets and outflows / binaries: symbiotic / stars: individual: BF Cygni
Based on data collected with 2-m telescope at the Rozhen National Astronomical Observatory and the David Dunlap Observatory.
Visiting Astronomer: Astronomical Institute, Tatranská Lomnica.
© ESO, 2013
1. Introduction
BF Cyg is an eclipsing symbiotic binary (Skopal 1992; Pereira & Landaberry 1996) comprising an M5 III giant (Mürset & Schmid 1999) and a white dwarf (WD) on a 757.2-d orbit (e.g. Fekel et al. 2001). The historical light curve of BF Cyg is dominated by a symbiotic nova-like outburst, which occurred around 1895 (Jacchia 1941) with a slow decline to the pre-outburst magnitudes, for almost one century, and a number of Z And-type outbursts superposed on the nova-like profile (see Fig. 1 of Skopal et al. 1997; Leibowitz & Formiggini 2006; Siviero et al. 2012). During outbursts the emission line spectrum is represented by the lines of low ionized elements (H i, He i, and neutral or singly ionized metals), whose profiles are often P Cyg-type. Their absorption component indicates a mass outflow at 100−200 to 500 km s-1 from the hot star (González-Riestra et al. 1990; Cassatella et al. 1992; Skopal et al. 1997; McKeever et al. 2011).
The recent outburst of BF Cyg started on 2006 July 31 (Munari et al. 2006), when the star’s brightness increased from U ~ 11.1 to U ~ 9.3 during 2006 August (Skopal et al. 2007). The low ionization state of the emission line spectrum and development of P Cyg profiles of H i, He i, and some Fe ii lines were reported by Sitko et al. (2006), Iijima (2006), and McKeever et al. (2011). An interesting feature of the current active phase is a high level of the star’s brightness, which is kept continuously at U ≲ 10 from the 2006 eruption to the present, i.e. for >6.3 years (Skopal et al. 2012, Fig. 1 here).
Our spectroscopic monitoring of BF Cyg revealed for the first time the emergence of satellite-emission components to the Hα and Hβ emission lines from 2009. To date, similar emissions in the optical spectra of symbiotic stars have only been discovered for Hen 3-1341 (Tomov et al. 2000), StHα 190 (Munari et al. 2001), and Z And (Skopal & Pribulla 2006), although a few jets have been discovered by other methods. In this contribution we present the evolution of these jet features from their emergence in 2009 to 2012 and determine their basic parameters.
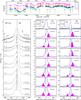 |
Fig. 1 Top panel: UBVRCIC light curves of BF Cyg covering its current, 2006-12, active phase (Skopal et al. 2007, 2012, and our unpublished data for >2011.9). Arrows indicate times of our spectroscopic observations. Lower panels: evolution of the Hα and Hβ line profiles along the outburst. The filled curves represent the jet emission components (Sect. 3.2). Fluxes are in 10-13 erg cm-2 s-1 Å-1. |
2. Observations and data reduction
Our spectroscopic observations were carried out at the David Dunlap Observatory, University of Toronto (DDO) and the Rozhen National Astronomical Observatory (RNAO). At the DDO the high-resolution spectroscopy was performed by the single dispersion slit spectrograph equipped with a Jobin Yovon Horiba CCD detector (2048 × 512 pixels of 13.5 μm size; thinned back illuminated chip) mounted at the Cassegrain focus of the 1.88-m telescope. The resolution power was 12 000 and 8000 around the Hα and He II 4686−Hβ regions, respectively. During each night two very different exposures were applied to obtain a well-defined Hα profile and the continuum.
At the RNAO the high-resolution spectroscopy was carried out by the single dispersion slit spectrograph equipped with the Photometrics CCD camera (1024 × 1024 pixels of 24 μm size) mounted at the coudé focus of the 2-m RCC telescope. The resolution power was 32 000 and 24 000 around the Hα and Hβ regions, respectively. To obtain a better signal-to-noise ratio, two exposures per night were made in some cases.
Basic treatment of the spectra was done using the IRAF-package software. The spectra were converted to fluxes in erg cm-2 s-1 Å-1 with the aid of the (near-)simultaneous BVRCIC photometry corrected for emission lines. Uncertainties of such a continuum calibration are a few percent for the star’s brightness around 9 mag in the VR passbands (see Skopal 2007,in detail). Observations were dereddened with EB−V = 0.35 (Mürset et al. 1991). The journal of spectroscopic observations is given in Table 1.
Log of spectroscopic observations.
3. Results
3.1. Evolution in the Hα and Hβ lines
Figures 1 and 2 show evolution of the Hα and Hβ profiles from the 2006 brightening to 2012 September. The broad wings expanding to ~± 2000 in Hα and ~± 1000 km s-1 in Hβ, were present in all spectra. Significant variations were observed mainly at/around the line cores. We summarize them as follows.
-
(i)
Just prior to the main brightening in 2006 August (2006 July 25 spectrum), the profiles showed a single emission peak with the broad wings.
-
(ii)
During the 2006 eruption, a sharp absorption developed on the blue side of the profile throughout the whole active phase. At some times, the Hβ profile was P Cyg type.
-
(iii)
During 2009, additional satellite emission bumps appeared on the sides of the Hα and Hβ emission core, placed at a few times 100 km s-1 from the line center (Table 2).
-
(iv)
During 2009–2011, the red satellite emissions were more pronounced, because of a strong absorption from the blue side of the line, which often consumed the blue Hβ wing totally. During 2010 May–2012 May, the blue Hβ satellite component transformed from absorption into emission.
-
(v)
During 2012, the satellite emissions occurred on both sides of the Hα and Hβ lines, nearly symmetrically with respect to their central emission (the dotted line in Fig. 1).
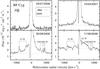 |
Fig. 2 Evolution in the Hβ line profile from around the 2006 August eruption to the formation of jets in 2009 (see Fig. 1), showing the pronounced absorption in P Cyg profiles of low-ionized metal lines at the spectrum from 11/06/2008, prior to detecting jets in 2009. |
3.2. Parameters of the satellite components
To isolate the satellite components from the whole line profile, we formally fitted the emission line core and its extended foot component with the Gaussian function (dotted lines in Fig. 1). We assumed them to be symmetrical with respect to the reference wavelength as suggested by observations during 2012 and before the eruption. Then the residual emissions were fitted with additional Gaussians (Fig. 1). From their parameters (the central wavelength, maximum I, and the width σ), we derived their radial velocity, RVS, flux  and the width
  . If more Gaussians were used to fit the satellite component, the above-mentioned parameters were estimated from their sum. Finally, we corrected the heliocentric radial velocity RVS for the systemic velocity and the orbital motion of the hot component as given by elements of Fekel et al. (2001). Resulting parameters are introduced in Table 2. This approach and the resolution of our spectra allowed us to estimate uncertainties in the RVS to 10−20 km s-1, in the FWHMS to 0.4 Å and in fluxes to 10−20% of the observed values.
The relatively small width of the satellite components (FWHMS = 245 ± 11 km s-1; the average from all values in Table 2 and the rms error) and their position RVS in the line profile suggest that these emissions are produced by radiation of a highly collimated ejection by the central star.
Parameters of Gaussian fits to the satellite emissions in Hα and Hβ lines.
3.3. Opening angle of the jets
The narrow profile of satellite lines with often sharp edges and a flat top (see Fig. 1) allows us to assume a constant velocity of the emitting particles in the jet. Then the observed line width can be the result of the dispersion in the line-of-sight velocity components of the jet particles. This can be fulfilled if the jet emitting medium has the geometry of a narrow cone with the peak at the central object and it is characterized by a small opening angle θ0. Assuming that the jets were launched perpendicularly to the disk plane that coincides with the orbital one, the opening angle can be expressed as a function of the observed width of the satellite component HWZIS, RVS and the orbital inclination i as ![Mathematical equation: \begin{equation} \theta_0 = 2\,\sin^{-1} \left[\frac{{\it HWZI}_{\rm S}}{RV_{\rm S}\tan(i)}\right], \end{equation}](/articles/aa/full_html/2013/03/aa21030-13/aa21030-13-eq47.png) (1)where HWZIS can be approximated with FWHMS (see Skopal et al. 2009,in detail). The orbital inclination is high, because of eclipses measured in both the optical and far-UV continuum (see Sect. 1). Skopal et al. (1997) estimated i ≈ 70°−90°. For the purpose of this paper, we adopted i = 80°. Such a high i is consistent with the mass function of 0.0239 M⊙, the mass ratio of ~3.8, and the considered mass of the WD, MWD = 0.6 M⊙ (Fekel et al. 2001). Corresponding parameters from Table 2 yield the average value of
(1)where HWZIS can be approximated with FWHMS (see Skopal et al. 2009,in detail). The orbital inclination is high, because of eclipses measured in both the optical and far-UV continuum (see Sect. 1). Skopal et al. (1997) estimated i ≈ 70°−90°. For the purpose of this paper, we adopted i = 80°. Such a high i is consistent with the mass function of 0.0239 M⊙, the mass ratio of ~3.8, and the considered mass of the WD, MWD = 0.6 M⊙ (Fekel et al. 2001). Corresponding parameters from Table 2 yield the average value of  , where the uncertainty represents a total differential of the function (1) for the uncertainty in the orbital inclination, Δi.
However, if the width of satellite components is in part caused by the velocity dispersion along the jet, then the opening angle will be <θ0.
3.4. Emission measure of the jets
Assuming that the radiation of jets is generated by the recombination transition in a line l (see Skopal et al. 2009), the luminosity Ljet(l) is related to the line emissivity, εlnenp by  (2)where εl is the volume emission coefficient of the line transition, ne and np are the concentrations of electrons and protons, Vjet and EMjet are the volume and emission measures of the jets. Thus, neglecting dependencies of εl on the electron temperature and density means EMjet can be expressed as
 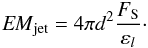 (3)The last column of Table 2 introduces quantities of EMjet for jet fluxes FS, distance d = 3.8 kpc (Skopal 2005), and coefficients εα = 1.83 for Hα and εβ = 0.682 × 10⁻²⁵ erg cm3 s-1 for Hβ (Te = 2 × 10⁴ K, e.g. Hummer & Storey 1987).
4. Conclusion
In this paper we reported a discovery of collimated ejection from the symbiotic star BF Cyg. The jets were indicated in the spectrum as satellite emission components to Hα and Hβ lines, which developed from 2009 – three years after the optical eruption. During 2012, they became bipolar (see Fig. 1). Parameters of satellite components suggest that the jets were collimated into the opening angle of ≲15°, and their radiation was produced by an optically thin medium with the emission measure of ~1−2 × 1059 (d/3.8 kpc)2 cm-3 (Table 2).
A detailed analysis of the present, unusually long-lasting outburst should aid us in better understanding the accretion process during active phases of symbiotic stars leading to formation of collimated ejection from their WDs.
Acknowledgments
We thank the referee, Joy Nichols, for constructive comments, Theodor Pribulla for acquiring the spectra at the David Dunlap observatory, Sergei Shugarov and Matej Sekeráš for taking some photometric observations from 2012, and Zuzana Cariková for help with their treatment. This research was supported by the Slovak-Bulgarian Research and Development Cooperation project SK-BG-0015-10, by the grant BSTC No. 01/14 Bulgaria-Slovakia, by the grant DO 02-85 of Bulgarian Scientific Research Fund, and by a grant of the Slovak Academy of Sciences VEGA No. 2/0002/13.
References
- Cassatella, A., Fernandez-Castro, T., Gonzalez-Riestra, R., & Fuensalida, J. J. 1992, A&A, 258, 368 [NASA ADS] [Google Scholar]
- Fekel, F. C., Hinkle, K. H., Joyce, R. R., & Skrutskie, M. 2001, AJ, 121, 2219 [NASA ADS] [CrossRef] [Google Scholar]
- González-Riestra, R., Cassatella, A., & Fernández-Castro, T. 1990, A&A, 237, 385 [NASA ADS] [Google Scholar]
- Hummer, D. G., & Storey, P. J. 1987, MNRAS, 224, 801 [NASA ADS] [CrossRef] [Google Scholar]
- Leibowitz, E. M., & Formiggini, L. 2006, MNRAS, 366, 675 [NASA ADS] [CrossRef] [Google Scholar]
- Iijima, T. 2006, CBET, 633 [Google Scholar]
- Jacchia, L. 1941, Bull. Harv. Coll. Obs., 915, 17 [NASA ADS] [Google Scholar]
- McKeever, J., Lutz, J., Wallerstein, G., Munari, U., & Siviero, A. 2011, PASP, 123, 1062 [NASA ADS] [CrossRef] [Google Scholar]
- Munari, U., Tomov, T., Yudin, B. F., et al. 2001, A&A, 369, L1 [NASA ADS] [CrossRef] [EDP Sciences] [Google Scholar]
- Munari, U., Siviero, A., Moretti, S., et al. 2006, CBET, 596 [Google Scholar]
- Mürset, U., & Schmid, H. M. 1999, A&AS, 137, 473 [NASA ADS] [CrossRef] [EDP Sciences] [Google Scholar]
- Mürset, U., Nussbaumer, H., Schmid, H. M., & Vogel, M. 1991, A&A, 248, 458 [NASA ADS] [Google Scholar]
- Pereira, C. B., & Landaberry, S. J. C. 1996, AJ, 111, 1329 [NASA ADS] [CrossRef] [Google Scholar]
- Sitko, M. L., Lynch, D. K., Russell, R. W., & Venturini, C. C. 2006, IAUC, 8746 [Google Scholar]
- Siviero, A., Tamajo, E., Lutz, J., Wallerstein, G., & ANS Collaboration 2012, Baltic Astron., 21, 188 [NASA ADS] [Google Scholar]
- Skopal, A. 1992, IBVS, 3780 [Google Scholar]
- Skopal, A. 2005, A&A, 440, 995 [NASA ADS] [CrossRef] [EDP Sciences] [Google Scholar]
- Skopal, A. 2007, New Astron., 12, 597 [NASA ADS] [CrossRef] [Google Scholar]
- Skopal, A., & Pribulla, T. 2006, ATel, 882 [Google Scholar]
- Skopal, A., Vittone, A. A., Errico, L., et al. 1997, MNRAS, 292, 703 [NASA ADS] [CrossRef] [Google Scholar]
- Skopal, A., Vaňko, M., Pribulla, T., et al. 2007, Astron. Nachr., 328, 909 [NASA ADS] [CrossRef] [Google Scholar]
- Skopal, A., Pribulla, T., Budaj, J., et al. 2009, ApJ, 690, 1222 [NASA ADS] [CrossRef] [Google Scholar]
- Skopal, A., Shugarov, S., Vaňko, M., et al. 2012, Astron. Nachr., 333, 242 [NASA ADS] [CrossRef] [Google Scholar]
- Tomov, T., Munari, U., & Marrese, P. M. 2000, A&A, 354, L25 [NASA ADS] [Google Scholar]
All Tables
All Figures
|
Fig. 1 Top panel: UBVRCIC light curves of BF Cyg covering its current, 2006-12, active phase (Skopal et al. 2007, 2012, and our unpublished data for >2011.9). Arrows indicate times of our spectroscopic observations. Lower panels: evolution of the Hα and Hβ line profiles along the outburst. The filled curves represent the jet emission components (Sect. 3.2). Fluxes are in 10-13 erg cm-2 s-1 Å-1. |
| In the text | |
|
Fig. 2 Evolution in the Hβ line profile from around the 2006 August eruption to the formation of jets in 2009 (see Fig. 1), showing the pronounced absorption in P Cyg profiles of low-ionized metal lines at the spectrum from 11/06/2008, prior to detecting jets in 2009. |
| In the text | |
Current usage metrics show cumulative count of Article Views (full-text article views including HTML views, PDF and ePub downloads, according to the available data) and Abstracts Views on Vision4Press platform.
Data correspond to usage on the plateform after 2015. The current usage metrics is available 48-96 hours after online publication and is updated daily on week days.
Initial download of the metrics may take a while.