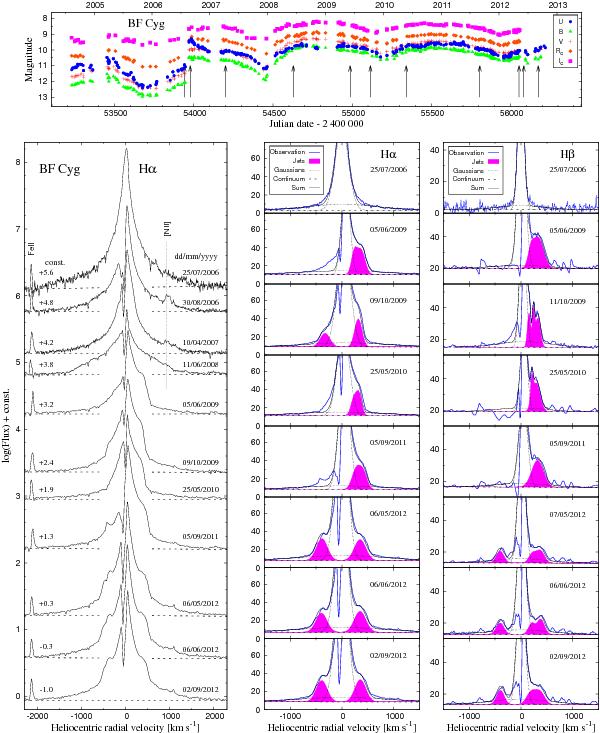
Fig. 1

Top panel: UBVRCIC light curves of BF Cyg covering its current, 2006-12, active phase (Skopal et al. 2007, 2012, and our unpublished data for >2011.9). Arrows indicate times of our spectroscopic observations. Lower panels: evolution of the Hα and Hβ line profiles along the outburst. The filled curves represent the jet emission components (Sect. 3.2). Fluxes are in 10-13 erg cm-2 s-1 Å-1.
Current usage metrics show cumulative count of Article Views (full-text article views including HTML views, PDF and ePub downloads, according to the available data) and Abstracts Views on Vision4Press platform.
Data correspond to usage on the plateform after 2015. The current usage metrics is available 48-96 hours after online publication and is updated daily on week days.
Initial download of the metrics may take a while.


