Fig. 6
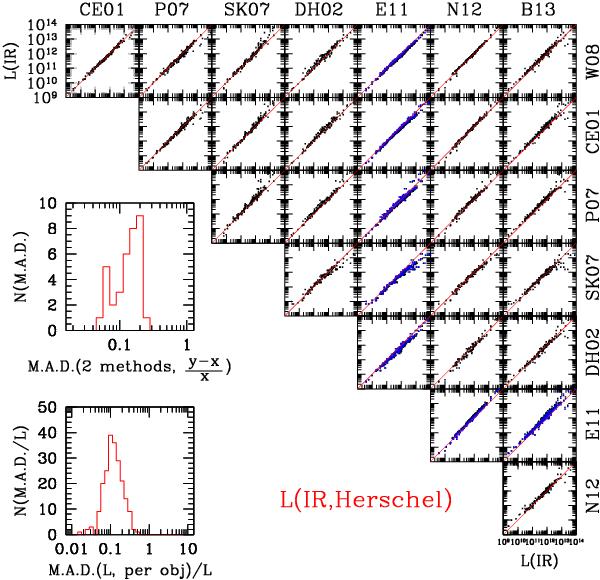
Testing L(IR) estimates using 8 different methods, and including Herschel data. The employed methods and templates are: Wuyts et al. (2008, W08); Chary & Elbaz (2001, CE01); Polletta et al. (2007, P07) fitted using hyper-z; Siebenmorgen & Krügel (2007, SK07) fitted with a custom code; Dale & Helou (2002, DH02); Elbaz et al. (2011, E11); Nordon et al. (2012, N12); and this work (B13). Elbaz et al. (2011) adopt two different templates (“main sequence”, shown in black, and “starburst”, in blue). See text for more detail about each method. Red diagonal lines simply mark the one to one relation. The large bottom left panel shows the distribution of the relative spread per object, computed as M.A.D./median using the 8 different L(IR) estimates per object. The large upper left panel, instead, depicts the distribution of scatter computed for each pair of methods as M.A.D. of the quantity (y − x)/x. In this case, x and y denote pairs of L(IR) estimates on the abscissa and ordinate axes, for each pair of methods.
Current usage metrics show cumulative count of Article Views (full-text article views including HTML views, PDF and ePub downloads, according to the available data) and Abstracts Views on Vision4Press platform.
Data correspond to usage on the plateform after 2015. The current usage metrics is available 48-96 hours after online publication and is updated daily on week days.
Initial download of the metrics may take a while.