Fig. 3
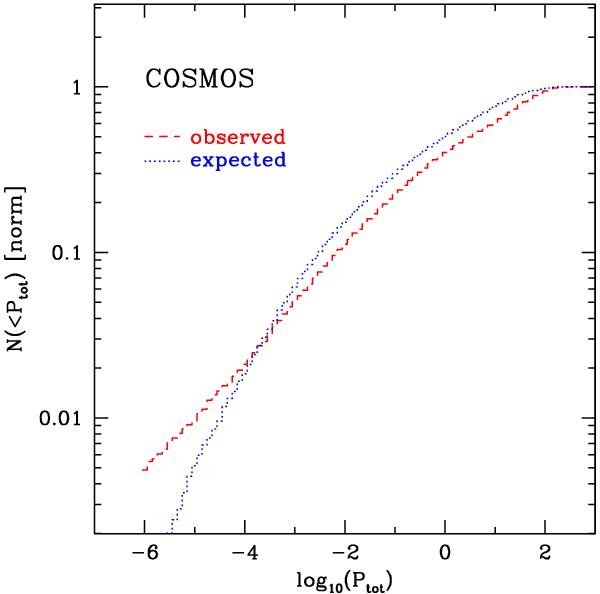
Cumulative distribution of probability densities in COSMOS. The red dashed line is for the observed sources, and is compared to simulated results (blue dotted line). The excess of observed sources, with respect to expectations from simulations, at the low probability side is due to rare objects, not complying with the restframe colors of Gaussian groups.
Current usage metrics show cumulative count of Article Views (full-text article views including HTML views, PDF and ePub downloads, according to the available data) and Abstracts Views on Vision4Press platform.
Data correspond to usage on the plateform after 2015. The current usage metrics is available 48-96 hours after online publication and is updated daily on week days.
Initial download of the metrics may take a while.