Fig. 9
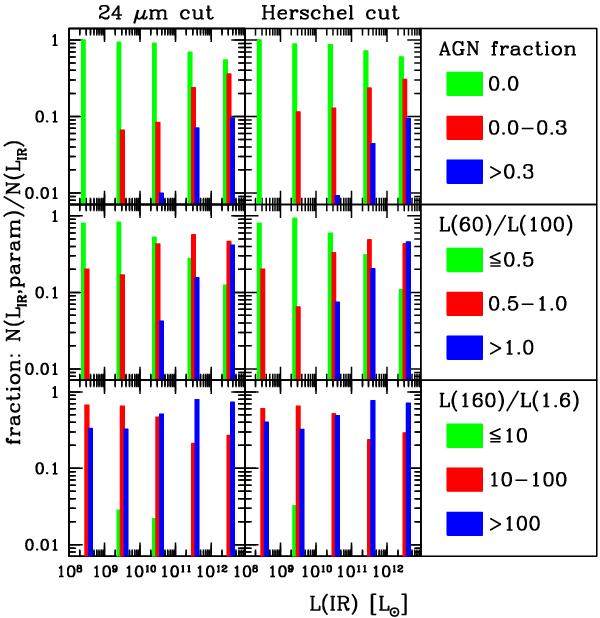
Relative distribution of GOODS-S sources as a function of AGN L(IR) fraction, L(60)/L(100) and L(160)/L(1.6), as indicated by the labeling in the right-hand panels, in different IR luminosity bins. Histograms are normalized to the number of sources in each L(IR) bin. Left/right panels refer to a 24 μm selection and sources detected by Herschel, respectively. Infrared luminosity bins are 1 dex wide, i.e. they cover ranges 108 − 109, 109 − 1010, etc.
Current usage metrics show cumulative count of Article Views (full-text article views including HTML views, PDF and ePub downloads, according to the available data) and Abstracts Views on Vision4Press platform.
Data correspond to usage on the plateform after 2015. The current usage metrics is available 48-96 hours after online publication and is updated daily on week days.
Initial download of the metrics may take a while.