| Issue |
A&A
Volume 551, March 2013
|
|
|---|---|---|
| Article Number | L5 | |
| Number of page(s) | 4 | |
| Section | Letters | |
| DOI | https://doi.org/10.1051/0004-6361/201220834 | |
| Published online | 14 February 2013 | |
A new flaring high-energy γ-ray source
1
INFN/LNF, via E. Fermi 40, 00044 Frascati,
Roma,
Italy
e-mail:
This email address is being protected from spambots. You need JavaScript enabled to view it.
2
Department of Physics, University of Roma Tre,
via della Vasca Navale 84,
00146
Roma,
Italy
3
INAF/IAPS, via Fosso del Cavaliere 100,
00133
Roma,
Italy
4
INAF/IASF-Bologna, via Piero Gobetti 101,
40129
Bologna,
Italy
5
Department of Physics, University of Roma “La
Sapienza”, Piazzale A. Moro
2, 00185
Roma,
Italy
6
Harvard-Smithsonian Astrophysical Observatory,
60 Garden Street,
Cambridge, MA
02138,
USA
7
ISDC, University of Geneva, Chemin d’Ecogia 16, Versoix, 1290,
Switzerland
Received:
3
December
2012
Accepted:
25
December
2012
Abstract
We report the detection of a new γ-ray source in the Fermi-LAT sky using a source detection tool based on the minimal spanning tree algorithm. The source, not reported in previous LAT catalogues but very recently observed in the X-rays and optical bands, is characterized by an increasing γ-ray activity in 2012 June–September that reached a weekly peak flux of (3.3 ± 0.6) × 10-7 photons cm-2 s-1. A search for a possible counterpart provides indication that it can be associated with the radio source NVSS J141828+354250, whose optical SDSS colours are typical of a blazar.
Key words: gamma rays: general / gamma rays: galaxies / galaxies: active / methods: data analysis
© ESO, 2013
1. Introduction
We report here the detection of a new high-energy γ-ray source (J1418+3542) performed in the analysis of archival Fermi-Large Area Telescope (LAT) sky images at energies higher than 3 GeV, using a source detection method based on the minimal spanning tree (MST) algorithm (Campana et al. 2008, and in prep.).
The LAT experiment (Atwood et al. 2009) is observing the entire sky in the 0.03 to >300 GeV band, about once every 3 h since 2008 August 04. With the increase of the sky exposure it is reasonable to expect that the number of detected stationary or moderately variable sources increases, thanks to the improved statistics. Moreover, it is also possible that a number of transient sources that exhibit a high variability (like many blazars) and provide a measurable signal only for a limited time interval can unexpectedly emerge in the γ-sky. Among these sources only γ-ray bursts (GRBs) and sources that exceed the threshold set by the LAT Collaboration of a daily average flux of 10-6 photons cm-2 s-1 are announced as a bright γ-ray source1. Other transient sources can only be observed by performing a periodic and systematic data analysis over time intervals of weeks or months. The new source was detected for the first time during an MST analysis of some selected regions of the sky of low Galactic diffuse emission background, over suitable time intervals, typically 6−12 months. Subsequently, the analysis was performed in a particular region of interest surrounding the source, and extended to the entire LAT archival dataset. This source started its measurable activity in 2011 February and it was not detected in the first two years of Fermi-LAT observations (2008 August−2010 August). It exhibited a moderate activity in 2011 June and its flux highly increased from 2012 June to September. The source was recently observed in flaring activity in November 2012 and its discovery was communicated by an Astronomer’s Telegram (ATel) on December 12 (Dutka et al. 2012; Mahabal et al. 2012). After the MST detection, we investigated the new source using the Fermi Science Tools2 to obtain count maps, light curves, and test statistics (TS) values by applying the maximum likelihood (ML) method. We also searched for possible counterparts.
Main MST parameters of the source J1418+3542 in the energy range 3–300 GeV and different time intervals.
 |
Fig. 1 Photon count maps centred at the new γ-ray source J1418+3542 for the data from 2008 Aug. 04−2012 Dec. 14 in the energy band 0.1−300 GeV (left panel), for the data from 2012 June 01 to 2012 September 30 (flare) in the energy band 0.1−300 GeV (central panel) and 3−300 GeV (right panel). The new source is circled at the centre of the region. White crosses mark 2FGL sources. |
2. MST detection of the new γ-ray source
MST is a topometric cluster-finding algorithm that exploits the pattern of “connectedness” of the detected photons, which are treated as the nodes in a graph, where the edges are the angular distances that connect them. The advantage of MST, and of other cluster-finding algorithms such as DBSCAN (Tramacere & Vecchio 2013), is the capability to quickly find potential γ-ray sources by examining only the incoming directions of the photons, regardless of their energy distribution. For our MST method we defined and successfully tested on simulated and real fields various selection parameters that are useful to assess the significance of the detected clusters and therefore their possible nature as genuine astrophysical sources (Campana et al. 2008, and in prep.; Massaro et al. 2009). In particular, we found that the parameter M, the so-called magnitude, which is defined as the number of photons N of a cluster multiplied by its clustering degree, i.e. the ratio of the mean edge length in the cluster to the mean value in the field, is a very good indicator of the detection significance. As shown by Campana et al. (in prep.), M values higher than 20 correspond to significance values higher than 4 standard deviations. Detected clusters can be further analysed with other well-recognized statistical methods, such as ML (Mattox et al. 1996), to obtain an independent evaluation of their statistical significance and to study the time and energy properties of the source. Our MST method was already applied to obtain lists of seed clusters for the 1FGL and 2FGL Fermi-LAT catalogues (Abdo et al. 2010; Nolan et al. 2012).
We considered all data collected by Fermi-LAT from 2008 August 04 to 2012 December 14 in a region in the north Galactic hemisphere, defined by a Galactic latitude b ≥ 60°. Data were filtered using the standard LAT science tools routines gtselect and gtmktime with a cut on the zenith angle (<100°) limb γ-rays and a cut on the rocking angle (>52°) to limit contamination from the Earth limb.
The MST analysis was applied to events in the 3–300 GeV energy range to avoid the low-energy background. This resulted in many clusters that were further filtered by applying a suitable threshold on M. Most of them matched within a 025 radius 2FGL sources in the region, but we also found 16 new significant clusters without any obvious γ-ray counterpart in LAT catalogues; three of them have M > 35 and one was found to have a very significant M = 286.8. The coordinates of its centre were computed by a weighted mean of the event coordinates with the inverse of their connecting edges Campana et al. (in prep.). Table 1 reports the equatorial and Galactic coordinates of the cluster centre together with the number of events and the MST magnitude for several time intervals: active period (2011 Feb. 01–2012 Dec. 14), pre-flare (2011 Feb. 01–2012 May 31), flare (2012 Jun. 01–2012 Sep. 30), all time (2008 Aug. 04–2012 Dec. 14).
The source is quite evident in Fig. 1, left panel, which shows the event count map of a region of interest (ROI) of 20° radius centred at the position of the cluster. This ROI contains 52 2FGL sources; the new source is one of the six brightest ones in the region. The two other panels in Fig. 1 show its brightening during the flare time window.
3. Time and spectral properties
To inspect rough features in the long-term light curve (LC) of the source we performed simple photometry following the standard Fermi-LAT aperture photometry procedure3. Figure 2 (top panel) shows the resulting monthly LC for the entire period (2008 Aug. 04–2012 Dec. 14) in the 0.1–100 GeV energy band, obtained by selecting events within a 1° aperture radius. No model source was assumed. The background level was evaluated from a close spatial region of equal size without detectable sources. Until about 2011 February (MJD ~ 55 600) the source was undetectable and remained at a quite low level until 2012 May. After that epoch its brightness increased and reached its maximum in about five weeks, followed by a decay of comparable duration.
An ML analysis was performed on data collected from 2011 Feb. 01 to 2012 Dec. 14, using the science tools package. We used the gtselect tool to apply the cuts suggested by the Fermi-LAT collaboration for point-like sources4 to minimize the impact of the systematics and the contamination from non-photon events. We extracted photons with energies between 100 MeV and 100 GeV, and used the P7SOURCE_V6 class event selection and the corresponding instrument response functions (IRF).
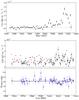 |
Fig. 2 Top panel: monthly aperture photometry light curve for the 0.1−100 GeV band from 2008 Aug. 04 to 2012 Dec. 14. The dashed line represents the background level. Central panel: weekly maximum likelihood light curve in the 0.1–100 GeV band, from 2011 Feb. 01 to 2012 Dec. 14. Downward triangles represent upper limits. Bottom panel: time evolution of the photon index; solid lines represent the mean value over the entire interval (black line) and during the flare (red line). |
We performed the spectral analysis using an unbinned ML estimator provided by the standard
tool gtlike, and modelled each source by means of a power law (PL).
Photons were extracted from a ROI centred at the MST coordinates, within a radius of
10°. The gtlike region model includes all point sources
from the 2FGL catalogue (Nolan et al. 2012) that fall
within 15° from the source and a background component of the isotropic and
Galactic diffuse emissions (standard models are available from the Fermi
Science Support Center5 (FSSC). The ML
analysis produced a weekly binned LC and a full-time spectral analysis. Since the 2FGL
catalogue provides a list of sources detected in a time window that does not overlap with
our full-time interval, and to take into account the possible changes in the activity of the
2FGL sources in each weekly bin, we adopted an iterative ML procedure to obtain an optimal
subtraction of the contribution of these sources. We selected a sub-region of the ROI with a
7° radius: all sources of the region model within this radius have both the flux and the
index parameter left free to vary. The remaining sources of the region model have the flux
parameter left free and the index parameter frozen at the 2FGL value. A first likelihood run
was performed to remove all sources with a detection significance below 3 σ
and number of photons <3 from the initial region model. A second
likelihood run was performed on the updated source list. Upper limits (UL) were evaluated
for all sources within the 7° radius region that were removed from the initial list. The
full-time spectral analysis was performed by testing a simple power law and a log-parabola
(LP),
dN/dE ∝ (E/E0)− Γ − βlog (E/E0)
(Massaro et al. 2004; Tramacere et al. 2011). In the case of LP spectral law, the parameter
β measures the curvature around the peak. The LP distribution has only
three free parameters, and the choice of the reference energy E0
does not affect the spectral shape; we fixed its value to 300 MeV. We used a TS based on the
likelihood ratio test6 (Mattox et al. 1996) to quantify the detection significance, and to check the PL
model (null hypothesis) against the LP model (alternative hypothesis). In the former case,
the TS is provided directly by gtlike, and the corresponding
detection significance given by the  is a ≈42σ confidence level (c.l.), a very robust detection. The TS for the
comparison between the PL and the LP models returns a value of about 6, corresponding to
about a 2.5 σ c.l., meaning that we have no statistical evidence of a
curved spectral shape. The same result is obtained using a broken power law spectral model
instead of an LP. The resulting weekly LC is plotted in the central panel of Fig. 2 and the corresponding photon index evolution is given in
the bottom panel. For the cases were the analysis returned flux upper limits, we did not
plot any photon index value. The fluctuations were around the mean value of ~2, with the
only possible exception of the flaring period (from MJD 56 080 to MJD 56 150) when it was
slightly harder, around ~1.8. In any case, the photon index returned by the likelihood
analysis can be biased when the statistics is low, hence we cannot draw any firm conclusion
about a spectral change. The full-time spectral energy distribution (SED) is reported in
Fig. 3: there is a mild indication of a steepening at
high energies, although it is not statistically significant considering the rather large
uncertainties. The best-fit parameters for the LP model are Γ = 1.82 ± 0.06 at
E0 = 300 MeV, β = 0.07 ± 0.02, while for the
PL model they are Γ = 2.03 ± 0.03. The 0.1–100 GeV integral flux during the activity period
is (1.14 ± 0.06) × 10-7 ph cm-2 s-1. The source has a
marginally significant detection in the pre-active period 2008 Aug.−2011 Jan. with a
TS = 197 and a 0.1–100 GeV flux of
(1.1 ± 0.4) × 10-8 ph cm-2 s-1.
is a ≈42σ confidence level (c.l.), a very robust detection. The TS for the
comparison between the PL and the LP models returns a value of about 6, corresponding to
about a 2.5 σ c.l., meaning that we have no statistical evidence of a
curved spectral shape. The same result is obtained using a broken power law spectral model
instead of an LP. The resulting weekly LC is plotted in the central panel of Fig. 2 and the corresponding photon index evolution is given in
the bottom panel. For the cases were the analysis returned flux upper limits, we did not
plot any photon index value. The fluctuations were around the mean value of ~2, with the
only possible exception of the flaring period (from MJD 56 080 to MJD 56 150) when it was
slightly harder, around ~1.8. In any case, the photon index returned by the likelihood
analysis can be biased when the statistics is low, hence we cannot draw any firm conclusion
about a spectral change. The full-time spectral energy distribution (SED) is reported in
Fig. 3: there is a mild indication of a steepening at
high energies, although it is not statistically significant considering the rather large
uncertainties. The best-fit parameters for the LP model are Γ = 1.82 ± 0.06 at
E0 = 300 MeV, β = 0.07 ± 0.02, while for the
PL model they are Γ = 2.03 ± 0.03. The 0.1–100 GeV integral flux during the activity period
is (1.14 ± 0.06) × 10-7 ph cm-2 s-1. The source has a
marginally significant detection in the pre-active period 2008 Aug.−2011 Jan. with a
TS = 197 and a 0.1–100 GeV flux of
(1.1 ± 0.4) × 10-8 ph cm-2 s-1.
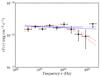 |
Fig. 3 Spectral energy distribution of the new source J1418+3542. Solid blue lines are the PL best fit uncertainty range, while red dashed lines correspond to the LP fit. |
4. Search for a possible counterpart
Considering that the accuracy for the coordinates of γ-ray sources
detected above a few GeV is of a few arcminutes, we searched for possible counterparts
within a cone of radius of 10′ centred at the source’s position using the ASDC
sky explorer tool8. There are only a few interesting
objects: the radio-quiet QSO SDSS J14186+3542
(z = 1.58) at 207, the X-ray source 1WGAJ1418.1+3543 at 463, which are not associated with a radio and optical
source, and the radio source GB6 J1418+3542 at the
angular distance of 123 and with a radio flux density at 4.85 GHz of about 40 mJy. The last
object appears as the most promising one. It is detected also at 1.4 GHz in the FIRST and
NVSS catalogues which report flux densities of 52 and 61 mJy, respectively, and therefore
its spectrum is rather flat. Well coincident with the FIRST position is the source SDSS J141828.58+354249.4 (, ) having
r = 19.74 mag and a colour index
u − r = 0.30 ± 0.05, corrected for the local interstellar
reddening, which is quite low at this high Galactic latitude. This blue colour index is
remarkably close to that of BL Lac objects of N type (Massaro
et al. 2012a) and of many flat spectrum radio quasars (FSRQs) associated with
γ-ray sources, providing a high confidence in the association with the
new flaring γ-ray source. This source is positionally consistent
(0 41 offset) with
the IR counterpart listed in the Wide-field Infrared Survey Explorer (WISE; Wright et al. 2010) WISE
J141828.61+354249.3, which according to the WISE All-sky catalogue9 is detected in the first three energy bands with the
following magnitudes: 3.4 μm = 14.983 ± 0.034,
4.6μm = 14.215 ± 0.042, 12μm = 11.958 ± 0.185. The
three-dimensional association procedure outlined in Massaro
et al. (2012c,b) cannot be entirely applied
to verify if WISE J141828.61+354249.3 has IR colours consistent with those of a blazar
because it is not detected at 22 μm. However, in the [3.4]−[4.6]−[12]
μm colour-colour diagram, it is consistent with typical IR colours of a
high-synchrotron-peaked BL Lac (HBL) as described in Massaro
et al. (2011) for the TeV BL lac objects. Finally, we note that the radio source
FIRST J141828.5+354249 is positionally consistent
both with SDSS (053 offset) and
with WISE (049 offset)
sources. Optical spectroscopic data of this source are not available and we cannot safely
establish whether it is a BL Lac object or a FSRQ. Nevertheless its blazar nature appears to
be well established and therefore it must be considered as the most interesting candidate
for the counterpart of our new source. The same source was also indicated by the follow-up
Swift-UVOT observations of Dutka et al.
(2012) as the most likely counterpart.
41 offset) with
the IR counterpart listed in the Wide-field Infrared Survey Explorer (WISE; Wright et al. 2010) WISE
J141828.61+354249.3, which according to the WISE All-sky catalogue9 is detected in the first three energy bands with the
following magnitudes: 3.4 μm = 14.983 ± 0.034,
4.6μm = 14.215 ± 0.042, 12μm = 11.958 ± 0.185. The
three-dimensional association procedure outlined in Massaro
et al. (2012c,b) cannot be entirely applied
to verify if WISE J141828.61+354249.3 has IR colours consistent with those of a blazar
because it is not detected at 22 μm. However, in the [3.4]−[4.6]−[12]
μm colour-colour diagram, it is consistent with typical IR colours of a
high-synchrotron-peaked BL Lac (HBL) as described in Massaro
et al. (2011) for the TeV BL lac objects. Finally, we note that the radio source
FIRST J141828.5+354249 is positionally consistent
both with SDSS (053 offset) and
with WISE (049 offset)
sources. Optical spectroscopic data of this source are not available and we cannot safely
establish whether it is a BL Lac object or a FSRQ. Nevertheless its blazar nature appears to
be well established and therefore it must be considered as the most interesting candidate
for the counterpart of our new source. The same source was also indicated by the follow-up
Swift-UVOT observations of Dutka et al.
(2012) as the most likely counterpart.
5. Discussion
The high-energy γ-ray sky, according to the new scenario derived from Fermi-LAT observations, appears to be dominated by thousands of sources, many of which are observed to be variable over different time scales. Searching for transient sources is useful to investigate their behaviour and, particularly, to evaluate the typical duration of their activity periods and the possible
relations with their luminosity and spectral properties, which in turn useful for estimating their contribution to the diffuse background in different energy bands. The new γ-ray source, found by us by means of the MST algorithm at energies higher than 3 GeV with M = 286.6, is clearly bright enough to be detected by any method. Its discovery was reported to the astronomical community after a new flare occurred on November 20 (Dutka et al. 2012; Mahabal et al. 2012) when our analysis was already complete. Selecting shorter time windows during the flaring period would produce a large increase of M even though the event number in the cluster is reduced, which confirms that M is a good indicator of the signal-to-noise ratio. Table 1 shows that the positional accuracy of our MST implementation is very good, which confirms that this clustering method is very promising for the detection and location of transient sources.
The time and spectral behaviour of J1418+3542 in the γ-ray band appear to be those of a blazar. Therefore we are confident about the proposed counterpart; we cannot safely establish, however, whether it is a BL Lac object or a FSRQ because its properties appears to be borderline between these two types. Radio and γ-ray spectra are suggestive of a quasar, while the IR WISE colours are those of a HBL source. Spectral measurements in the optical band would be very useful to establish its nature.
Finally, we underline that the brighter flare has a typical FWHM duration (5 months) of about 10% of the entire observation period, suggesting that an elusive population of extragalactic sources characterized by even shorter activity time intervals can actually exist and contribute to the isotropic background. Efficient tools for detecting these sources are therefore very useful for a complete description of the high-energy cosmic landscape.
The TS statistics is defined as −2 Log (L0/L1), where L0 and L1 are the maximum likelihood estimated for the null and alternative hypothesis, respectively.
The 2FGL catalogue (Nolan et al. 2012) used a threshold of TS = 25 and an integration time ~20% shorter.
Acknowledgments
Part of this work is based on archival data, software or on-line services provided by the ASI Science Data Center (ASDC). We furthermore acknowledge use of archival Fermi and SDSS data. Funding for the SDSS and SDSS-II has been provided by the Alfred P. Sloan Foundation, the Participating Institutions, the National Science Foundation, the U.S. Department of Energy, the National Aeronautics and Space Administration, the Japanese Monbukagakusho, the Max Planck Society, and the Higher Education Funding Council for England. The SDSS Web Site is http://www.sdss.org. We are very grateful to Gino Tosti for useful discussions and to the referee for her/his insightful comments.
References
- Abdo, A. A., Ackermann, M., Ajello, M., et al. 2010, ApJS, 188, 405 [NASA ADS] [CrossRef] [Google Scholar]
- Atwood, W. B., Abdo, A. A., Ackermann, M., et al. 2009, ApJ, 697, 1071 [NASA ADS] [CrossRef] [Google Scholar]
- Campana, R., Massaro, E., Gasparrini, D., Cutini, S., & Tramacere, A. 2008, MNRAS, 383, 1166 [NASA ADS] [CrossRef] [Google Scholar]
- Dutka, M., Ojha, R., Tanaka, Y., & Sokolovsky, K. 2012, The Astronomer’s Telegram, 4643 [Google Scholar]
- Mahabal, A. A., Drake, A. J., Djorgovski, S. G., et al. 2012, The Astronomer’s Telegram, 4645 [Google Scholar]
- Massaro, E., Perri, M., Giommi, P., & Nesci, R. 2004, A&A, 413, 489 [NASA ADS] [CrossRef] [EDP Sciences] [Google Scholar]
- Massaro, E., Tinebra, F., Campana, R., & Tosti, G. 2009, in 2009 Fermi Symposium eConf Proc., C091122 [Google Scholar]
- Massaro, F., D’Abrusco, R., Ajello, M., Grindlay, J. E., & Smith, H. A. 2011, ApJ, 740, L48 [NASA ADS] [CrossRef] [Google Scholar]
- Massaro, E., Nesci, R., & Piranomonte, S. 2012a, MNRAS, 422, 2322 [NASA ADS] [CrossRef] [Google Scholar]
- Massaro, F., D’Abrusco, R., Tosti, G., et al. 2012b, ApJ, 750, 138 [NASA ADS] [CrossRef] [Google Scholar]
- Massaro, F., D’Abrusco, R., Tosti, G., et al. 2012c, ApJ, 752, 61 [NASA ADS] [CrossRef] [Google Scholar]
- Mattox, J. R., Bertsch, D. L., Chiang, J., et al. 1996, ApJ, 461, 396 [NASA ADS] [CrossRef] [Google Scholar]
- Nolan, P. L., Abdo, A. A., Ackermann, M., et al. 2012, ApJS, 199, 31 [NASA ADS] [CrossRef] [Google Scholar]
- Tramacere, A., & Vecchio, C. 2013, A&A, 549, A138 [NASA ADS] [CrossRef] [EDP Sciences] [Google Scholar]
- Tramacere, A., Massaro, E., & Taylor, A. M. 2011, ApJ, 739, 66 [NASA ADS] [CrossRef] [Google Scholar]
- Wright, E. L., Eisenhardt, P. R. M., Mainzer, A. K., et al. 2010, AJ, 140, 1868 [NASA ADS] [CrossRef] [Google Scholar]
All Tables
Main MST parameters of the source J1418+3542 in the energy range 3–300 GeV and different time intervals.
All Figures
|
Fig. 1 Photon count maps centred at the new γ-ray source J1418+3542 for the data from 2008 Aug. 04−2012 Dec. 14 in the energy band 0.1−300 GeV (left panel), for the data from 2012 June 01 to 2012 September 30 (flare) in the energy band 0.1−300 GeV (central panel) and 3−300 GeV (right panel). The new source is circled at the centre of the region. White crosses mark 2FGL sources. |
| In the text | |
|
Fig. 2 Top panel: monthly aperture photometry light curve for the 0.1−100 GeV band from 2008 Aug. 04 to 2012 Dec. 14. The dashed line represents the background level. Central panel: weekly maximum likelihood light curve in the 0.1–100 GeV band, from 2011 Feb. 01 to 2012 Dec. 14. Downward triangles represent upper limits. Bottom panel: time evolution of the photon index; solid lines represent the mean value over the entire interval (black line) and during the flare (red line). |
| In the text | |
|
Fig. 3 Spectral energy distribution of the new source J1418+3542. Solid blue lines are the PL best fit uncertainty range, while red dashed lines correspond to the LP fit. |
| In the text | |
Current usage metrics show cumulative count of Article Views (full-text article views including HTML views, PDF and ePub downloads, according to the available data) and Abstracts Views on Vision4Press platform.
Data correspond to usage on the plateform after 2015. The current usage metrics is available 48-96 hours after online publication and is updated daily on week days.
Initial download of the metrics may take a while.