| Issue |
A&A
Volume 551, March 2013
|
|
|---|---|---|
| Article Number | A21 | |
| Number of page(s) | 6 | |
| Section | Interstellar and circumstellar matter | |
| DOI | https://doi.org/10.1051/0004-6361/201220806 | |
| Published online | 12 February 2013 | |
Revealing the inclined circumstellar disk in the UX Orionis system KK Ophiuchi⋆
1 Max Planck Institut für Radioastronomie, Auf dem Hügel 69, 53121 Bonn, Germany
e-mail: This email address is being protected from spambots. You need JavaScript enabled to view it.
2 Havard-Smithsonian Center for Astrophysics, 60 Garden Street, MS-78, Cambridge, MA 02138, USA
3 Pulkovo Observatory of RAS, Pulkovskoe shosse 65, 196140 St. Petersburg, Russia
4 V.V. Sobolev Astronomical Institute, St. Petersburg University, St. Petersburg, Russia
5 INAF Osservatorio Astrofisico di Arcetri, Largo Fermi 5, 50125 Firenze, Italy
6 Université Joseph Fourier (UJF) – Grenoble 1/CNRS-INSU, Institut de Planételogie et d’Astrophysique de Grenoble (IPAG) UMR 5274, 38041 Grenoble, France
7 Laboratoire Lagrange, UMR 7293 UNS-CNRS-OCA, Boulevard de l’Observatoire, BP 4229, 06304 Nice Cedex 4, France
Received: 28 November 2012
Accepted: 4 January 2013
Abstract
Aims. We study the inner sub-AU region of the circumstellar environment of the UX Ori-type star KK Oph with near-infrared VLTI/AMBER interferometry. We are particularly interested in the inclination of the star-disk system, and we use this information to test the current standard picture for UX Ori stars.
Methods. We recorded spectrally dispersed (R ~ 35) interferograms in the near-infrared H and K bands with the VLTI/AMBER instrument. The derived visibilities, closure phases, and the spectral energy distribution of KK Oph were compared with two-dimensional geometric and radiative transfer models (RADMC).
Results. We obtained visibilities at four different position angles. Using two-dimensional geometric models, we derive an axis ratio ~3.0 corresponding to an inclination of ~70°. A fitted inclined ring model leads to a ring radius of 2.8 ± 0.2 mas, corresponding to 0.44 ± 0.03 AU at a distance of 160 pc, which is larger than the dust sublimation radius of ~0.1 AU predicted for a dust sublimation temperature of 1500 K. Our derived two-dimensional RADMC model consists of a circumstellar disk with an inclination angle of ~70° and an additional dust envelope.
Conclusions. The finding of an ~70° inclined disk around KK Oph is consistent with the prediction that UX Ori objects are seen under large inclination angles, and orbiting clouds in the line of sight cause the observed variability. Furthermore, our results suggest that the orbit of the companion KK Oph B and the disk plane are coplanar.
Key words: techniques: interferometric / stars: pre-main sequence / stars: individual: KK Ophiuchi / circumstellar matter
Based on observations made with ESO telescopes at Paranal Observatory under program ID: 083.D-0224(C) and 088.C-0575(A).
Member of the International Max Planck Research School (IMPRS) for Astronomy and Astrophysics at the Universities of Bonn and Cologne.
© ESO, 2013
1. Introduction
UX Ori stars (UXORs) are young stars showing irregular brightness variations. A typical decrease of two to three magnitudes in the V band is observed for a few days to a couple of weeks. One of the current theories links these brightness variations to obscurations of the central star by orbiting dust clouds in an almost edge-on disk (Grinin et al. 1994; Natta & Whitney 2000; Grinin et al. 1991; Natta et al. 1997). Variable contributions to the total luminosity by unsteady accretion onto the central star may also play a role (Herbst & Shevchenko 1999). The location of the obscuring dust clouds is still an open question. Turbulent filaments at the location of the puffed-up inner rim may also create such short-lived obscuration events (Dullemond et al. 2003). There might even be a puffed-up inner rim of variable height whose dust clumps occasionally intersect the line of sight. If the disk inclination in those systems were approximately face-on, alternative explanations of the UX Ori phenomenon would be required. In that case, the source of obscuration must be located outside the disk and in the vicinity of the star (Vinković & Jurkić 2007; Tambovtseva & Grinin 2008; Bans & Königl 2012). The obscuration might also be triggered by the presence of perturbing bodies in the disk (Rostopchina et al. 2007; Demidova et al. 2010; Artemenko et al. 2010).
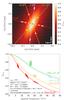 |
Fig. 1 Fit of an elliptical, two-component Gaussian model to all derived visibilities Vcirc of the circumstellar environment (i.e., exclusive of the central star). Top: uv coverage of the observations (white dots) and our elliptical, two-component Gaussian model consisting of a compact and an extended Gaussian (see Table 2). Bottom: observed visibilities of the circumstellar environment (at four different PAs; color-coded) and visibility cuts (four lines; same color-coding as the observations) through the visibilities of our two-dimensional, elliptical Gaussian model. We fitted this two-dimensional Gaussian model to all visibilities instead of fitting one-dimensional visibility models to the visibilities corresponding to a single PA. (This figure is available in color in the electronic form.) |
KK Oph is a binary system with a separation of 1.5 arcsec whose primary, KK Oph A, is a UX Ori star with spectral type A6Ve (Leinert et al. 1997). The companion, KK Oph B, is a T Tauri star with spectral type G6Ve (Carmona et al. 2007). KK Oph A, for simplicity hereafter referred to as KK Oph, is a highly irregular variable star located near the dark cloud B56 (Swope 1928; Herbst & Shevchenko 1999). Photometric studies by Herbst & Shevchenko (1999) showed strong variations of two magnitudes in the V band. Yudin & Evans (1998) found that the wavelength dependence of polarization toward KK Oph is different from interstellar polarization, indicating a possible intrinsic property of the polarizing material.
In this paper, we present the first near-infrared interferometric observations of the UX Ori-type star KK Oph. In Sect. 2, we describe our observations and the data reduction. In Sect. 3, we discuss our geometric and radiative transfer modeling and the derived disk inclination of KK Oph. We present the results in Sect. 4 and a conclusion in Sect. 5.
Observation log of the VLTI/AMBER low-resolution (R~35) observations of KK Oph.
2. Observations and data reduction
We observed KK Oph with the AMBER instrument of the Very Large Telescope Interferometer (VLTI) using the linear array configuration H0-G0-E0 and the triangle configuration H0-G1-I1 of the auxiliary telescopes (ATs) in April 2009 and February 2012, respectively (see position angle coverage in Fig. 1). Because the field-of-view of AMBER/AT observations is only 0.25 arcsec, the 1.5 arcsec binary companion has no influence on the visibility measurements of the primary star. The AMBER instrument (Petrov et al. 2007) combines up to three telescope beams creating spectrally dispersed three-beam interferograms. We recorded H- and K-band interferograms in the low spectral resolution mode (R ~ 35) with a detector integration time (DIT) of 200 ms. The data reduction was performed using the data reduction software amdlib v3.0.31. We selected 20% of the frames with the highest fringe signal-to-noise ratio (S/N) as described in Tatulli et al. (2007) and applied a histogram equalization method for piston correction (Kreplin et al. 2012). The observation log is shown in Table 1. From the 2009 data (data set A; see Table 1), we could extract H- and K-band visibilities between 1.6 − 1.8 μm and 2.0 − 2.4 μm. Due to poor seeing of 1.3 arcsec during the night of 2012-02-23, we could only extract K-band data from data sets B and C (Table 1). Because data sets B and C were taken consecutively within one hour, we decided to average the visibilities and closure phases to improve the S/N. AMBER recombines the light of three telescopes, so we were also able to extract closure phases (see Fig. 2, middle right). The 2009 data show average closure phases of 10.7 ± 10.9° and the 2012 data − 3.4 ± 13.5°, which imply a nearly centro-symmetric brightness distribution within the errors of our observations. For modeling and interpretation, we complemented our near-infrared AMBER data with existing mid-infrared MIDI data of KK Oph (Leinert et al. 2004).
Best-fit geometric models of the AMBER visibilities.
3. Modeling
To characterize the size and shape of KK Oph, we fitted simple centro-symmetric geometric models to the observed visibilities. Because the visibilities depend on both the flux of the unresolved central star and the circumstellar structure, we first derived the visibility Vcirc of the circumstellar environment (i.e., exclusive of the central star)  (1)where F⋆ is the stellar flux, Fcirc the circumstellar flux component, V⋆ the stellar visibility and Vmeas the measured visibility. We set V⋆ = 1, because the central star is unresolved by the baselines used in our observation (stellar radius ~0.05 mas at d = 160 pc; Leinert et al. 2004). The circumstellar-to-stellar flux ratio was derived for every spectral channel by fitting a Kurucz model (Kurucz 1979) to the spectral energy distribution (SED) data (Leinert et al. 2004) of KK Oph. We used a Kurucz model with the following stellar parameters: Teff = 8500 K, log (g) = 4, log (Z/H) = −2.5 for a stellar radius of R⋆ = 2.0 R⊙ at a distance of d = 160 pc (Leinert et al. 2004). For the central wavelength in our H- and K-band data, we derived Fcirc/F⋆ = 6.6 for λ = 2.2 μm and Fcirc/F⋆ = 2.6 for λ = 1.7 μm. In Fig. 1 we plot the visibilities Vcirc.
3.1. Geometric ring and Gaussian models
Because the near-infrared visibilities of KK Oph (see Fig. 1) suggest an elongated structure, we fit two-dimensional geometric models (elliptical Gaussian and inclined ring) to our data. In these two-dimensional geometric models, we have three free parameters: the length r of the major axis (half-width-at-half-maximum, HWHM, in the case of the Gaussian), the axis ratio a/b of the major axis a to the minor axis b, and the position angle (PA) of the minor axis. The best-fit solutions of these models were unable to describe the near-infrared visibility data well (large  ; see first two rows in Table 2). The disagreement between our data and the models is mainly due to the visibility values at the shortest baselines at ~15 m. These visibilities suggest an additional extended component. To account for this extended component, we describe the model visibility Vmodel by
  (2)where Fext and Vext denote the flux and visibility of the extended component. To keep the number of model parameters as low as possible, we first assumed a completely over-resolved extended component (i.e., Vext = 0) and thus obtained only one additional free parameter – the flux ratio fh between the circumstellar disk and the extended component. In subsequent steps, the size of the extended component is also a free parameter. We assumed that the emission of both components originates from the same physical structure. Therefore, the inclination angle and the axis ratio of both components was assumed to be the same. The best-fit parameters of these two-dimensional geometric models are summarized in Table 2.
We found that a single elliptical Gaussian or inclined ring model were unable to fit the near-infrared visibilities well. By introducing an over-resolved component, the corresponding χ2 values are significantly reduced (see Table 2). The best fit was derived with a compact elliptical Gaussian plus an extended, concentric elliptical Gaussian component with an HWHM of the two major axes of 0.38 ± 0.19 AU and 1.32 ± 0.10 AU. We derived a flux ratio of the extended to the compact inner component of fh = 0.36 ± 0.06, an axis ratio for both Gaussians of a/b = 3.00 ± 0.03 and a PA of the minor axis of − 26.0 ± 1.4° on the sky. We also list the best-fit ring-model parameters in Table 2, because we need these model parameters in Sect. 4.
3.2. Two-dimensional radiative transfer model of a disk and an envelope
For a more physical interpretation of our data, we used the axisymmetric radiative transfer code RADMC (Dullemond & Dominik 2004). This code can calculate parameterized circumstellar density structures with or without a vertical puffed-up inner rim. The code is well tested and used specifically for modeling circumstellar disks of young stellar objects (YSOs; e.g., Dullemond et al. 2003; Pontoppidan et al. 2007). A basic model consists of a central star surrounded by a circumstellar disk. The vertical density structure at a certain radius R is described by  (3)H(R) = H(Rdisk)(R/Rdisk)α denotes the pressure scale height at a given radius R, where Rdisk is the outer disk radius. The surface density Σ(R) is a parameterized function given by Σ(R) = Σ(Rdisk)(R/Rdisk)p.
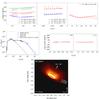 |
Fig. 2 RADMC model of KK Oph (disk-envelope model; see model parameters in Table 3; lines: model, dots: data). Top left and top center: near-infrared visibilities (color–coded). Top right: mid-infrared visibilities. Middle left: SED. Middle right: closure phases. Bottom: near-infrared intensity distribution of the RADMC model (log-scaling). The central stellar source was omitted in this representation. |
We calculated the models corresponding to hundreds of combinations of parameter values in order to obtain a roughly systematic scanning of the parameter space. The inclination and position angle are quite well constrained with errors of approximately 10%, whereas the other parameters are only roughly constrained with estimated errors in the range of 20−30% derived from the model differences. These large parameter errors are caused by the errors of the observations and the poor uv coverage. In other words, the presented radiative transfer model is not unique, but represents a first physical model that tries to simultaneously reproduce all interferometric and photometric data of KK Oph. In this radiative transfer model, we assumed an interstellar grain size distribution with n(a) ~ a-3.5 (Mathis et al. 1977) with small grains (amin = 0.005 μm, amax = 1.0 μm) and large grains (amin = 1.0 μm, amax = 1000 μm). The dust composition is a mixture of equal parts astronomical silicates (Draine & Lee 1984) and amorphous carbon (Jager et al. 1998). We calculated hundreds of models with different parameter combinations. However, we were unable to find a good fit of both the SED and near- and mid-infrared visibilities simultaneously.
Finally, to account for the extended component required in the previous section, we also added an envelope composed of small (0.5 μm) grains to the disk model. For this envelope component, we also tested other single grain sizes of 0.01 μm, 0.1 μm, and 1.0 μm for the extended envelope model but found a reasonable fit only for the single grain size of 0.5 μm. For the density distribution of this envelope, we assumed a simple power law ρ(r) = ρ0(r/r0)-1, where ρ0 denotes the dust density at a characteristic radius r0 (see Kraus et al. 2008). However, this simple spherical envelope model was also not satisfying. It increased the goodness of the visibility fit but overestimated the required flux levels. Therefore, to decrease this flux level, we removed parts of the dust envelope in the polar regions resembling a cavity structure similar to bipolar outflow cavities found in many other YSOs (e.g., Whitney & Hartmann 1992; Weigelt et al. 2006). For the assumed cavity in our model, we chose a simple cone geometry, which extends from the inner disk radius to the outer radius of the envelope (the cavity region was set to a constant density of 10-90 g/cm3). The envelope extends from the inner disk radius of 0.56 AU to 3 AU and shows an opening angle of the cavities of ~40°. The reference dust density at 1 AU is 1.8 × 10⁻¹⁸ g/cm3.
Free fit parameters and derived values of our RADMC model of KK Oph.
The disk component is a 70°-inclined circumstellar disk with a puffed-up inner rim located at Rsub = 0.56 AU and with a temperature Tsub = 1100 K (see Table 3). The scale height of the rim is Hrim/Rrim = 0.04. The surface density profile drops with an exponent of p = −1.5. The parameters of our obtained radiative-transfer model are summarized in Table 3. A near-infrared image of this model composed of the circumstellar disk and an envelope with cavities is shown in Fig. 2 (bottom). With this model, we can simultaneously reproduce the near- and mid-infrared visibilities at all available position angles as well as the SED of KK Oph. However, other types of models based on other assumptions (e.g., models without the discussed cavities) may exist, of course, and may be able to reproduce the observations as well.
4. Discussion
The geometric modeling of the KK Oph data showed that the intensity distribution has a strong elongation and that an additional extended component is required to reproduce the visibilities. The best-fit two-dimensional geometric ring model consists of a ring-shaped intensity distribution with an inclination angle of ~71° (i.e., almost edge-on) located at a distance of ~0.4 AU from the central star with an extended component contributing to 0.41 of the total near-infrared flux.
To compare KK Oph with other Herbig Ae/Be stars, we plotted its inclination-corrected K-band ring-fit radius into the size-luminosity relation for Herbig Ae/Be stars (see Fig. 3). We show (1) the radius obtained with a model of a circumstellar environment consisting of just an inclined ring and (2) the radius of the model consisting of an inclined ring and an additional extended envelope component. Both radii are larger than the dust sublimation radius of ~0.15 AU predicted for a dust sublimation temperature of 1500 K, but are roughly consistent with a dust sublimation temperature of ~1000 K (see Fig. 3).
Our presented radiative transfer model consists of a disk with a similar inclination angle of ~70° and an additional dust envelope. Envelopes or halos were found in many previous studies of YSOs (e.g., Whitney & Hartmann 1992; Weigelt et al. 2006; Vinković et al. 2006; Monnier et al. 2006; Chen et al. 2012). The PA of the minor axis of the elongated intensity distribution (system axis) is approximately − 30°. Therefore, the companion KK Oph B (PA = − 112.8°; Herbig 2005) is located roughly in the disk plane (PA ~ − 120°), as illustrated in Fig. 2 (bottom), which supports binary formation models leading to coplanarity (Maheswar et al. 2002).
The obscuration events of UX Ori stars can be explained by orbiting clouds in the circumstellar disk or disk atmosphere (Grinin et al. 1991; Natta & Whitney 2000; Vinković & Jurkić 2007) if the disk inclination is large enough, as, for example, the inclination of the disk of KK Oph (~70°). The physical mechanism that can produce the required structure is still under debate, but it may be a centrifugally driven dusty disk wind (Bans & Königl 2012). Our finding of an inclined disk agrees with other types of observations. The large optical depth toward KK Oph was already found by de Winter & The (1990), who suggested a flattened dust geometry. Mora et al. (2001) found the rotational velocity of KK Oph to be 177 km s-1, which is similar to the rotational velocity of the prototype star UX Ori (175 km s-1; Hillenbrand et al. 1995) and might be caused by a large inclination (Grady et al. 1996). In an optical polarimetry study, Oudmaijer et al. (2001) measured the V-band polarization of KK Oph to 5.26%. With this V-band polarization and a V-band variability of ~2 mag (Herbst & Shevchenko 1999), UX Ori models by Natta & Whitney (2000) predict a disk inclination between ~60 − 68°, which is consistent with our measurement of ~70°.
5. Summary and conclusion
We presented the first near-infrared interferometric measurements of the UX Ori star KK Oph. The star was observed with the VLTI/AMBER instrument at four different PAs. The following results were obtained.
The best-fit two-dimensional geometric model consists of two elliptical Gaussian components with an axis ratio of a/b ~ 3 and a PA of the minor axis of approximately − 26°, which suggests the presence of a circumstellar disk with a large inclination angle of ~70° (i.e., almost edge-on). We used the two-dimensional radiative transfer code RADMC for a more physical modeling of the KK Oph data. We found a model that is consistent with the near- and mid-infrared visibilities and the SED of KK Oph. This model consists of an ~70° inclined circumstellar disk with an additional extended envelope that consists of a spherical structure with cavities with an opening angle of ~40°.
The PA of the system axis is approximately − 30° (see Fig. 2, bottom). This suggests that the companion KK Oph B (PA = − 112.8°) is located in the disk plane (PA ~ − 120°), which supports binary formation models leading to coplanarity. Our results support the hypothesis that the disks of UX Ori stars are seen under large inclination angles. Our measured large inclination angle of KK Oph agrees with several other studies (de Winter & The 1990; Leinert et al. 2004). More near-infrared interferometric observations with better uv coverage are needed in the future to reconstruct model-independent aperture-synthesis images of the disk and envelope of KK Oph.
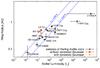 |
Fig. 3 Size-luminosity diagram of a sample of Herbig Ae/Be stars (adapted from Monnier et al. 2005). Red triangle: major axis of a fitted inclined ring model. Orange triangle: major axis of the inclined ring of a fitted model consisting of an inclined ring and an extended Gaussian (see Table 2). |
The AMBER reduction package amdlib is available at: http://www.jmmc.fr/data_processing_amber.htm
Acknowledgments
A. Kreplin was supported for this research through a stipend from the International Max Planck Research School (IMPRS) for Astronomy and Astrophysics at the Universities of Bonn and Cologne. V.G. and L.T. were supported in part by the grant of the Presidium of RAS P 21 and grant NSh. – 1625.2012.2. They also thank the Max-Planck-Society for the support during their stay in Bonn. This research has made use of NASA’s Astrophysics Data System Bibliographic Services.
References
- Artemenko, S. A., Grankin, K. N., & Petrov, P. P. 2010, Astron. Rep., 54, 163 [NASA ADS] [CrossRef] [Google Scholar]
- Bans, A., & Königl, A. 2012, ApJ, 758, 100 [NASA ADS] [CrossRef] [Google Scholar]
- Carmona, A., van den Ancker, M. E., & Henning, T. 2007, A&A, 464, 687 [NASA ADS] [CrossRef] [EDP Sciences] [Google Scholar]
- Chen, L., Kreplin, A., Wang, Y., et al. 2012, A&A, 541, A104 [NASA ADS] [CrossRef] [EDP Sciences] [Google Scholar]
- de Winter, D., & The, P. S. 1990, Ap&SS, 166, 99 [NASA ADS] [CrossRef] [Google Scholar]
- Demidova, T. V., Grinin, V. P., & Sotnikova, N. Y. 2010, Astron. Lett., 36, 498 [NASA ADS] [CrossRef] [Google Scholar]
- Draine, B. T., & Lee, H. M. 1984, ApJ, 285, 89 [Google Scholar]
- Dullemond, C. P., & Dominik, C. 2004, A&A, 417, 159 [NASA ADS] [CrossRef] [EDP Sciences] [Google Scholar]
- Dullemond, C. P., van den Ancker, M. E., Acke, B., & van Boekel, R. 2003, ApJ, 594, L47 [NASA ADS] [CrossRef] [Google Scholar]
- Grady, C. A., Perez, M. R., Talavera, A., et al. 1996, A&AS, 120, 157 [NASA ADS] [CrossRef] [EDP Sciences] [Google Scholar]
- Grinin, V. P., Kiselev, N. N., Chernova, G. P., Minikulov, N. K., & Voshchinnikov, N. V. 1991, Ap&SS, 186, 283 [NASA ADS] [CrossRef] [Google Scholar]
- Grinin, V. P., The, P. S., de Winter, D., et al. 1994, A&A, 292, 165 [NASA ADS] [Google Scholar]
- Herbig, G. H. 2005, AJ, 130, 815 [NASA ADS] [CrossRef] [Google Scholar]
- Herbst, W., & Shevchenko, V. S. 1999, AJ, 118, 1043 [NASA ADS] [CrossRef] [Google Scholar]
- Hillenbrand, L. A., Meyer, M. R., Strom, S. E., & Skrutskie, M. F. 1995, AJ, 109, 280 [NASA ADS] [CrossRef] [Google Scholar]
- Jager, C., Mutschke, H., & Henning, T. 1998, A&A, 332, 291 [NASA ADS] [Google Scholar]
- Kraus, S., Preibisch, T., & Ohnaka, K. 2008, ApJ, 676, 490 [NASA ADS] [CrossRef] [Google Scholar]
- Kreplin, A., Kraus, S., Hofmann, K.-H., et al. 2012, A&A, 537, A103 [NASA ADS] [CrossRef] [EDP Sciences] [Google Scholar]
- Kurucz, R. L. 1979, ApJS, 40, 1 [NASA ADS] [CrossRef] [Google Scholar]
- Leinert, C., Richichi, A., & Haas, M. 1997, A&A, 318, 472 [NASA ADS] [Google Scholar]
- Leinert, C., van Boekel, R., Waters, L. B. F. M., et al. 2004, A&A, 423, 537 [NASA ADS] [CrossRef] [EDP Sciences] [Google Scholar]
- Maheswar, G., Manoj, P., & Bhatt, H. C. 2002, A&A, 387, 1003 [NASA ADS] [CrossRef] [EDP Sciences] [Google Scholar]
- Mathis, J. S., Rumpl, W., & Nordsieck, K. H. 1977, ApJ, 217, 425 [NASA ADS] [CrossRef] [Google Scholar]
- Monnier, J. D., Millan-Gabet, R., Billmeier, R., et al. 2005, ApJ, 624, 832 [NASA ADS] [CrossRef] [Google Scholar]
- Monnier, J. D., Berger, J.-P., Millan-Gabet, R., et al. 2006, ApJ, 647, 444 [NASA ADS] [CrossRef] [Google Scholar]
- Mora, A., Merín, B., Solano, E., et al. 2001, A&A, 378, 116 [NASA ADS] [CrossRef] [EDP Sciences] [Google Scholar]
- Natta, A., & Whitney, B. A. 2000, A&A, 364, 633 [NASA ADS] [Google Scholar]
- Natta, A., Grinin, V. P., Mannings, V., & Ungerechts, H. 1997, ApJ, 491, 885 [NASA ADS] [CrossRef] [Google Scholar]
- Oudmaijer, R. D., Palacios, J., Eiroa, C., et al. 2001, A&A, 379, 564 [NASA ADS] [CrossRef] [EDP Sciences] [Google Scholar]
- Pasinetti Fracassini, L. E., Pastori, L., Covino, S., & Pozzi, A. 2001, A&A, 367, 521 [NASA ADS] [CrossRef] [EDP Sciences] [Google Scholar]
- Petrov, R. G., Malbet, F., Weigelt, G., et al. 2007, A&A, 464, 1 [NASA ADS] [CrossRef] [EDP Sciences] [Google Scholar]
- Pontoppidan, K. M., Dullemond, C. P., Blake, G. A., et al. 2007, ApJ, 656, 980 [NASA ADS] [CrossRef] [Google Scholar]
- Rostopchina, A. N., Grinin, V. P., Shakhovskoi, D. N., Lomach, A. A., & Minikulov, N. K. 2007, Astron. Rep., 51, 869 [NASA ADS] [CrossRef] [Google Scholar]
- Swope, H. H. 1928, Harvard College Observatory Bulletin, 862, 29 [NASA ADS] [Google Scholar]
- Tambovtseva, L. V., & Grinin, V. P. 2008, Astron. Lett., 34, 231 [NASA ADS] [CrossRef] [Google Scholar]
- Tatulli, E., Millour, F., Chelli, A., et al. 2007, A&A, 464, 29 [NASA ADS] [CrossRef] [EDP Sciences] [Google Scholar]
- Vinković, D., & Jurkić, T. 2007, ApJ, 658, 462 [NASA ADS] [CrossRef] [Google Scholar]
- Vinković, D., Ivezić, Ž., Jurkić, T., & Elitzur, M. 2006, ApJ, 636, 348 [NASA ADS] [CrossRef] [Google Scholar]
- Weigelt, G., Beuther, H., Hofmann, K.-H., et al. 2006, A&A, 447, 655 [NASA ADS] [CrossRef] [EDP Sciences] [Google Scholar]
- Whitney, B. A., & Hartmann, L. 1992, ApJ, 395, 529 [NASA ADS] [CrossRef] [Google Scholar]
- Yudin, R. V., & Evans, A. 1998, A&AS, 131, 401 [NASA ADS] [CrossRef] [EDP Sciences] [Google Scholar]
All Tables
All Figures
|
Fig. 1 Fit of an elliptical, two-component Gaussian model to all derived visibilities Vcirc of the circumstellar environment (i.e., exclusive of the central star). Top: uv coverage of the observations (white dots) and our elliptical, two-component Gaussian model consisting of a compact and an extended Gaussian (see Table 2). Bottom: observed visibilities of the circumstellar environment (at four different PAs; color-coded) and visibility cuts (four lines; same color-coding as the observations) through the visibilities of our two-dimensional, elliptical Gaussian model. We fitted this two-dimensional Gaussian model to all visibilities instead of fitting one-dimensional visibility models to the visibilities corresponding to a single PA. (This figure is available in color in the electronic form.) |
| In the text | |
|
Fig. 2 RADMC model of KK Oph (disk-envelope model; see model parameters in Table 3; lines: model, dots: data). Top left and top center: near-infrared visibilities (color–coded). Top right: mid-infrared visibilities. Middle left: SED. Middle right: closure phases. Bottom: near-infrared intensity distribution of the RADMC model (log-scaling). The central stellar source was omitted in this representation. |
| In the text | |
|
Fig. 3 Size-luminosity diagram of a sample of Herbig Ae/Be stars (adapted from Monnier et al. 2005). Red triangle: major axis of a fitted inclined ring model. Orange triangle: major axis of the inclined ring of a fitted model consisting of an inclined ring and an extended Gaussian (see Table 2). |
| In the text | |
Current usage metrics show cumulative count of Article Views (full-text article views including HTML views, PDF and ePub downloads, according to the available data) and Abstracts Views on Vision4Press platform.
Data correspond to usage on the plateform after 2015. The current usage metrics is available 48-96 hours after online publication and is updated daily on week days.
Initial download of the metrics may take a while.