| Issue |
A&A
Volume 551, March 2013
|
|
|---|---|---|
| Article Number | A10 | |
| Number of page(s) | 11 | |
| Section | Astronomical instrumentation | |
| DOI | https://doi.org/10.1051/0004-6361/201220661 | |
| Published online | 12 February 2013 | |
Apodized phase mask coronagraphs for arbitrary apertures
Mechanical & Aerospace Engineering, Princeton
University,
Olden street, 08544,
Princeton
NJ,
USA
e-mail:
This email address is being protected from spambots. You need JavaScript enabled to view it.
Received:
30
October
2012
Accepted:
19
December
2012
Abstract
Context. Phase-mask coronagraphs can be seen as linear systems that spatially redistribute in the pupil plane the energy collected by the telescope. Most of the on-axis light must ideally be rejected outside the aperture so as to be blocked with a Lyot stop, while almost all of the off-axis light must go through it. The unobstructed circular apertures of off-axis telescopes make this possible but all of the major telescopes are on-axis, however, and the performance of these coronagraphs is dramatically reduced by their central obstructions.
Aims. Their performance can be restored by using an additional optimally designed apodizer that changes the amplitude in the first pupil plane so that the on-axis light is rejected outside the obstructed aperture of the on-axis telescope.
Methods. An apodizer is assumed to be located in a pupil plane, a phase mask in a subsequent image plane, and a Lyot stop in a reimaged pupil plane. The numerical optimization model is built by maximizing the apodizer’s transmission while setting constraints on the extremum values of the electric field that the Lyot stop does not block. The coronagraphic image is compared to what a non-apodized phase mask coronagraph provides and an analysis is made of the trade-offs that exist between the transmission of the apodizer and the properties of the Lyot stop.
Results. The existence of a solution and the transmission of the mask depend on the geometries of the aperture and of the Lyot stop, and on the constraints that are set on the on-axis attenuation. The system’s throughput is a concave function of the Lyot stop transmission. In the case of a VLT-like aperture, optimal apodizers with a transmission of 16% to 92% associated with a four-quadrant phase mask provide contrast as low as a few 10-10 at 1 λ/D from the star. The system’s maximum throughput is about 64% for an apodizer with an 88% transmission and a Lyot stop with a 69% transmission. It is shown that optimizing apodizers for a vortex phase mask requires computation times much longer than in the previous case, and no result is presented for this mask.
Conclusions. It is demonstrated that apodizers can be successfully optimized to allow phase mask coronagraphs to be used with the full aperture of on-axis telescopes while delivering contrast as low as, or even lower than what they could provide by themselves with off-axis telescopes.
Key words: instrumentation: high angular resolution / techniques: high angular resolution / methods: analytical / methods: numerical
© ESO, 2013
1. Introduction
Over the past 20 years, indirect detection methods have provided us with a now exhaustive catalog of confirmed companions1 and an even longer list of potential companions2. One of the most striking conclusion so far is that the percentage of rocky planets (including larger and/or heavier Earths) is larger than previously anticipated (Borucki et al. 2011; Batalha et al. 2012). This is only valid, however, for planets with short periods, which are at a small distance from their star (about 0.25 AU in the case of a solar-type star).
Several indirect detection methods exist: radial velocimetry, transits, astrometry, micro-lensing, pulsar timing. Transits have been used to probe exoplanet atmospheres (Burrows et al. 2006), and basic molecules such as water, methane, or carbon dioxide have been detected in the atmosphere of five planets.
While direct imaging methods cannot currently be used to characterize the planets detected by transits, they can be used to look for larger planets that are further away from their star. Some instruments are already being used (Hinkley et al. 2011).
The spatial and spectral resolutions of near-future direct imaging near-infrared instruments will make it possible to study planets around nearby stars in much finer detail (Macintosh et al. 2008; Beuzit et al. 2010; Beichman et al. 2010; Lagage & European MIRI Team 2010; Sivaramakrishnan et al. 2010; Enya & S. W. Group 2011).
Many instruments have been proposed for detecting and analyzing planet light by direct imaging. In this paper, phase mask coronagraphs and apodized coronagraphs are primarily considered. The stellar Lyot coronagraph (Lyot 1932; Kenknight 1977) was first modified by Roddier & Roddier (1997). The focal amplitude mask was replaced by a focal phase mask, a disk centered on the star that induces a π phase shift. Destructive interferences in the following pupil plane led to a partial cancellation of the star light. It was shown later that this null can be made total if a spheroidal prolate apodizer is used in addition (Aime et al. 2002).
Rouan proposed another phase mask, the four-quadrant phase mask (4QPM) to cancel the on-axis starlight entirely, without using any apodization (Rouan et al. 2000). This mask induces a π phase shift of the electric field in two opposite quadrants of the image plane, slightly attenuating the light coming from the planets if it happens to fall on the edges of the quadrants. Eight-octants phase masks (8OPM) have also been studied. While their geometry reduces the discovery area in the image plane, they are also less sensitive to low-order aberrations (Murakami et al. 2008; Carlotti et al. 2009) than the 4QPM.
These phase mask coronagraphs may suffer from chromaticity: π phase shifts are usually induced by laying on the surface of a plane-parallel window a thin transparent film that is then selectively etched (Riaud et al. 2003). The phase shift that is induced depends on the thickness of the film, on its refraction index, and on the wavelength. A first solution to this problem is to use N masks designed as many different wavelengths in as many successive image planes (Galicher et al. 2011). Other possibilities to induce a partial achromatic phase shift consist in using semi-achromatic polarizing elements (half-wave plates) (Mawet et al. 2003; Boccaletti et al. 2008), or sub-wavelength gratings (Mawet et al. 2005). A Mach-Zehnder interferometer can also be used to induce an achromatic π phase shift (Aime et al. 2007), although many more optical elements are required than in the other designs.
Finally, Mawet et al. (2005) presented the vector vortex coronagraph (VVC). The vortex phase mask (VPM) induces an azimuthal phase shift, from 0 to 2lθ, where θ is the azimuth, and l the topological charge, an even integer strictly greater than 0. The VVC also cancels the on-axis star light entirely, but contrary to the 4QPM, the geometry of the VPM does not reduce the discovery area. Several manufacturing techniques are considered for the VVC (liquid crystal polymers, sub-wavelength gratings, and photonics crystals), and a partial achromatization is possible (for more details see Mawet et al. 2011).
The Roddier & Roddier mask can be modified to improve its overall performance and its achromaticity by adding a phase-shifting annulus to the central mask to form a dual-zone mask (Soummer et al. 2003). Like the Roddier & Roddier mask, the dual-zone mask can be combined with an apodization, which can induce a perfect null in a broadband as long as its transmission varies chromatically in a specific manner (N’diaye et al. 2012).
All phase masks have been extensively studied through numerical simulations, and many of them through laboratory experiments (Mawet et al. 2009; Baudoz et al. 2010). On-sky observations have been conducted with the 4QPM coronagraph (Gratadour et al. 2005) and the VVC (Mawet et al. 2010), but all three masks have been designed for circular clear apertures, not centrally obstructed apertures. As a consequence, their performance has been greatly limited. The VVC has for example been tested on a 1.5 m subaperture of the 5 m Palomar telescope, reducing its effective resolution to a third of its value, and its transmission to a ninth. It was nevertheless able to successfully observe three of the four planets of the HR8799 planetary system (Serabyn et al. 2010; more information on the discovery of these planets can be found in Marois et al. 2008, 2010). In the specific case of this observation, using a subaperture also had the advantage of mitigating the impact of wavefront errors.
Phase-mask coronagraphs will be used in three major high-contrast instruments. On the ground, the spectro-polarimetric high-contrast exoplanet research (SPHERE) instrument will use three 4QPM designed for the J, H, and K bands (Beuzit et al. 2010). In space, the mid-infrared instrument of the James Webb space telescope (JWST-MIRI) will also use a series of 4QPM (Cavarroc et al. 2008). SPHERE should see its first light in 2013, while the JWST should be launched in 2018. A partially transmissive Roddier & Roddier mask is currently studied for the SCExAO instrument at the Subaru telescope (Martinache et al. 2011), where it would be used in the focal plane of a phase-induced amplitude apodization (PIAA) coronagraph (Guyon 2003; Guyon et al. 2010). Still at the Subaru telescope, 4QPM, 8OPM (Murakami et al. 2010) and VPM are also likely to be tested.
A possible solution to the problem of on-axis observations, apart from the use of subapertures, involves two-stage optical layouts. For instance, two VPM (Serabyn et al. 2011) or two 4QPM (Galicher et al. 2011) can be set in series (in two successive image planes). This reduces the impact of the central obstruction. It also involves twice as many optics, each of them bringing additional aberrations to the wavefront, and making the alignment more difficult than a single-stage layout.
This paper presents a different solution to on-axis observations with phase mask coronagraphs. Apodizers can be optimally designed in two dimensions to cancel the on-axis light of a star when used with a 4QPM or VPM. The apodizer is set in a pupil plane that comes before the image plane in which the phase mask is located. The optimization of the apodizer is in many ways similar to the optimization of 2D binary apodizers, i.e. 2D shaped pupils.
While binary pupil masks have long been used by astronomers (Schultz & Frazier 1983), their optimization for high-contrast has first been proposed about ten years ago (Spergel & Kasdin 2001). Several different types of masks have been designed since (Vanderbei et al. 2003; Kasdin et al. 2007), and they share properties with external occulters. While initially optimized in one dimension, it was shown more recently that they can be optimized in 2D (Carlotti et al. 2011). This makes it possible to tailor the pupil plane transmission pixel by pixel. As a consequence, apodizers can be computed for any aperture, including centrally obstructed and segmented apertures.
The optimization problem consists in maximizing the transmission of the apodizer under constraints set on the extremum values of the amplitude of the electric field in selected regions of the image plane. Because the problem is convex and the electric field is computed through a linear operation (a Fourier transform), a unique solution exists and can be found efficiently. To limit the computation time required by these numerical optimizations, the number of resolution elements along both axes of the pupil plane is usually kept under a thousand, and under a few tens in the image plane.
Computing a shaped pupil that restores the performance of a phase mask coronagraph is also possible, though at first glance the complexity of the computations appears to be much greater since one or two more Fourier transforms must be computed. Constraints are set on the extremum values of the amplitude of the electric field, either in the Lyot plane (within the limits of a Lyot stop) or in the final image plane.
The problem can be simplified, however, by noting that the operator that transforms the electric field in the first pupil plane into the electric field in the second pupil plane is linear. It is thus not mandatory to explicitly compute the two successive Fourier transforms. This can drastically reduce the complexity of the computation. More importantly, it prevents computation errors to spread from one plane to another and eliminates the constraint on the sampling of the electric field in the first image plane.
Even if the electric field in the intermediate image plane is not explicitly computed, the finite angular extension of the image plane must be specified. Phase mask coronagraphs require the phase shift to be applied on the largest possible area of the image plane, usually within a circle with a minimum radius of 32 or 64λ/D (Riaud et al. 2001).
Section 2 derives the equations that are later used to compute the electric field in the Lyot plane as a function of the apodizing pattern used in the entrance pupil plane, and of the phase-shift induced by the mask in the first pupil plane. The case of the 4QPM and of the VPM are considered separately. Section 3 gives the details of the discretization of the calculations and the construction of the optimization problem. Section 4 analyzes the impacts of the central obstruction and of the finite size of the focal mask on the high-contrast performance of a 4QPM and a VPM. The results of the optimizations are presented in the same section, before being discussed in Sect. 5.
2. Fourier optics formalism
The optical layout is represented in Fig. 1. Four planes are indicated, noted with letters A, B, C, and D. They correspond to the successive pupil- and image planes, where the apodizer, the phase mask, the Lyot stop, and the camera are located. The telescope’s pupil is assumed to have a diameter D. The observation wavelength is noted λ, and the letter F denotes the focal length of the lenses or mirrors used to reimage the various pupil- and image planes.
 |
Fig. 1 Schematic drawing of the optical layout. The successive pupil and image planes A, B, C, and D are the locations of the apodizer, the phase mask, the Lyot stop, and the camera. The plano-convex lenses were chosen to denote the use of a focusing element. They could be replaced for example with achromatic doublets, spherical or off-axis parabolic mirrors. |
The apodizer and the telescope aperture are assumed to be symmetric with respect to the
x and y axes, and since their transmission is real, the
Fourier transform E(u,v) of the apodizer
A(x, y) is a real, even function (with
the exception of a scalar uniform phase factor). Its expression is given as follows, in
angular units: 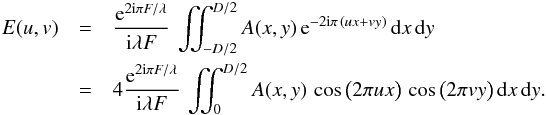 (1)
(1)
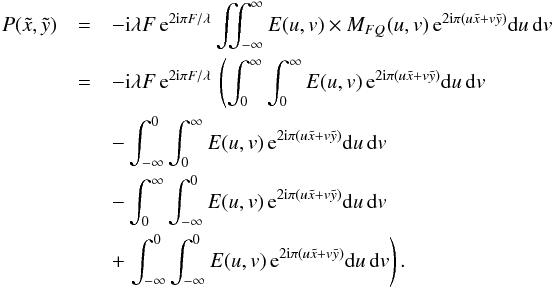
2.1. Four-quadrant phase mask
The 4QPM can be described through the odd function
MFQ(u,v) = sign(u) × sign(v),
and the electric field in the reimaged pupil plane is the inverse Fourier transform of
E(u,v) × MFQ(u,v):
 (2)For
the moment, the dimensions of the focal phase mask are assumed to be infinite. After a few
algebraic transformations, this expression can be reduced to
(2)For
the moment, the dimensions of the focal phase mask are assumed to be infinite. After a few
algebraic transformations, this expression can be reduced to
 (3)Plugging in the
expression for E(u,v) as a function of A(x,
y) leads to
(3)Plugging in the
expression for E(u,v) as a function of A(x,
y) leads to 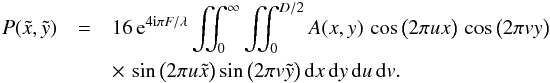 (4)The
integrations over u and v can be considered separately,
(4)The
integrations over u and v can be considered separately,
![Mathematical equation: \begin{eqnarray} P(\tilde{x},\tilde{y}) &=& 16 \, {\rm e}^{4 {\rm i} \pi F/\lambda} \iint_{0}^{D/2} A(x,y) \, \left[\int_{0}^{\infty} \cos \big( 2 \pi u x \big) \sin \big( 2 \pi u \tilde{x} \big) \, {\rm d}u \right. \nonumber\\ && \left. \times \int_{0}^{\infty} \cos \big( 2 \pi v y \big) \sin \big( 2 \pi v \tilde{y} \big) \, {\rm d}v \right] \, {\rm d}x \, {\rm d}y, \end{eqnarray}](/articles/aa/full_html/2013/03/aa20661-12/aa20661-12-eq26.png) (5)or
equivalently,
(5)or
equivalently, 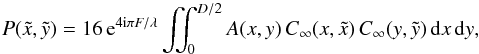 (6)where the function
C∞(α,β) that has been introduced is defined
as
(6)where the function
C∞(α,β) that has been introduced is defined
as  (7)While it is not possible
to find an analytical expression for C∞ if the integration
domain is semi-infinite, it does become possible for a finite domain. In fact, phase masks
can only cover a finite area of the image plane, and this restriction – instead of being
an artificial assumption – is mandatory. It also means that any light outside this finite
domain is blocked. This loss of throughput is negligible, however (for example, more than
99% of the Airy pattern energy is concentrated inside a circle of radius
20λ/D, and more than 90% inside a
circle of radius 2λ/D). The
expressions of CL (where L
is the angular half-width covered by the mask) is written in units of
λ/D
(7)While it is not possible
to find an analytical expression for C∞ if the integration
domain is semi-infinite, it does become possible for a finite domain. In fact, phase masks
can only cover a finite area of the image plane, and this restriction – instead of being
an artificial assumption – is mandatory. It also means that any light outside this finite
domain is blocked. This loss of throughput is negligible, however (for example, more than
99% of the Airy pattern energy is concentrated inside a circle of radius
20λ/D, and more than 90% inside a
circle of radius 2λ/D). The
expressions of CL (where L
is the angular half-width covered by the mask) is written in units of
λ/D (8)This
concludes our analysis of the mathematical formalism used for the four-quadrant phase
mask. Indeed, to compute the electric field
(8)This
concludes our analysis of the mathematical formalism used for the four-quadrant phase
mask. Indeed, to compute the electric field  , one
only has to plug in the expressions of CL
found in Eq. (8). Note that in this case
the mask covers a square region of the image plane centered on its origin.
, one
only has to plug in the expressions of CL
found in Eq. (8). Note that in this case
the mask covers a square region of the image plane centered on its origin.
A closed form for the Fourier transform of , and
therefore the attenuated image of the star, could be found as long as no Lyot stop is
introduced in that plane. As using a Lyot stop appears to be mandatory, however, this
additional step is not explored further.
2.2. Vortex phase mask
The VPM can be represented mathematically through the complex function
MV(θ) = eiθl,
where l, the topological charge, is an even integer strictly greater than
0, and tan(θ) = v/u.
The real part of this function is even (with respect to u and
v), while its imaginary part is odd. Contrary to the 4QPM, the phase
induced by the VPM cannot be represented by the product of a function of
u and a function of v:
 (9)Because
the phase induced by the mask depends on θ, the integration in plane B is
made with respect to the polar coordinates ρ and θ
instead of u and v:
(9)Because
the phase induced by the mask depends on θ, the integration in plane B is
made with respect to the polar coordinates ρ and θ
instead of u and v:
 (10)Plugging
in the expression for the electric field E(u,v) as a
function of A(x,y) gives
(10)Plugging
in the expression for the electric field E(u,v) as a
function of A(x,y) gives ![Mathematical equation: \begin{eqnarray} \label{P2PV} P(\tilde{x},\tilde{y}) &=& -{\rm e}^{4 {\rm i} \pi F/\lambda} \! \! \iint_{-D/2}^{D/2} A(x,y) \int_{0}^{\infty} \!\!\! \! \int_{0}^{2\pi}\! \!{\rm e}^{-2 {\rm i} \pi \rho ((x\!-\!\tilde{x}) \cos(\theta)\!+\!(y\!-\!\tilde{y}) \sin(\theta))} \nonumber \\[2mm] & &\times {\rm e}^{{\rm i} \theta l} \, \rho \, {\rm d}\rho \, {\rm d}\theta \, {\rm d}x \, {\rm d}y \nonumber \\[2mm] &=& -{\rm e}^{4 {\rm i} \pi F/\lambda} \iint_{-D/2}^{D/2} A(x,y) \times F(x,\tilde{x}, y,\tilde{y}) \, {\rm d}x \, {\rm d}y, \end{eqnarray}](/articles/aa/full_html/2013/03/aa20661-12/aa20661-12-eq42.png) (11)where
(11)where
 denotes
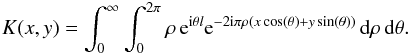
the double integral with respect to ρ and θ. One can
notice that Eq. (11) can also be written
as the convolution of A(x,y) and a kernel
K(x,y), which is the Fourier transform of the mask:
denotes
the double integral with respect to ρ and θ. One can
notice that Eq. (11) can also be written
as the convolution of A(x,y) and a kernel
K(x,y), which is the Fourier transform of the mask:
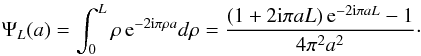
 (12)In
any case, the integral with respect to ρ has a closed form if the domain
of integration is finite and not semi-infinite:
(12)In
any case, the integral with respect to ρ has a closed form if the domain
of integration is finite and not semi-infinite:
 (13)A
closed form can then be sought for the integral with respect to θ. We
only consider here the case of the topological charge l = 2:
(13)A
closed form can then be sought for the integral with respect to θ. We
only consider here the case of the topological charge l = 2:
![Mathematical equation: \begin{eqnarray} && F(x,\tilde{x},y,\tilde{y}) = \int_{0}^{2\pi} {\rm e}^{2{\rm i}\theta} \, \Psi_{L}\Big( (x-\tilde{x}) \cos(\theta) + (y-\tilde{y}) \sin(\theta) \Big) \, {\rm d}\theta \nonumber \\[2mm] && = {\rm e}^{2 {\rm i} \phi(x,\tilde{x},y,\tilde{y})} \, \left( \frac{J_{0}(2 \pi L \, r(x,\tilde{x},y,\tilde{y}) )-1}{\pi \, r(x,\tilde{x},y,\tilde{y})^2}+\frac{L \, J_{1}(2 \pi L \, r(x,\tilde{x},y,\tilde{y}) )}{r(x,\tilde{x},y,\tilde{y})} \right)\nonumber \\[2mm] & &\textrm{where } r(x,\tilde{x},y,\tilde{y}) = \sqrt{(x-\tilde{x})^2+(y-\tilde{y})^2} \nonumber \\[2mm] && \textrm{ and } \phi(x,\tilde{x},y,\tilde{y}) = \tan^{-1}\left(\frac{y-\tilde{y}}{x-\tilde{x}}\right)\cdot \label{FinF} \end{eqnarray}](/articles/aa/full_html/2013/03/aa20661-12/aa20661-12-eq48.png) (14)The
electric field can be
computed using Eq. (11), the expression of
(14)The
electric field can be
computed using Eq. (11), the expression of
 being
given in Eq. (14). Note that contrary to
the case of the four-quadrant phase mask, and contrary to the case of a classical Fourier
transform, the integrals with respect to x and y cannot
be separated. This is a major obstacle to a fast computation of the electric field in
plane C. The symmetries of the apodization pattern
A(x,y) and of the real and imaginary parts of
can be
used to integrate over a smaller domain of plane A, however,:
being
given in Eq. (14). Note that contrary to
the case of the four-quadrant phase mask, and contrary to the case of a classical Fourier
transform, the integrals with respect to x and y cannot
be separated. This is a major obstacle to a fast computation of the electric field in
plane C. The symmetries of the apodization pattern
A(x,y) and of the real and imaginary parts of
can be
used to integrate over a smaller domain of plane A, however,: 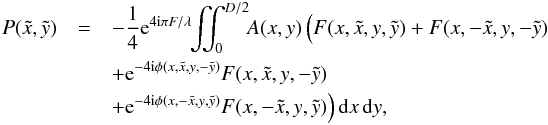 (15)while
the integration is then made over a fourth of the pupil, the function
has to
be evaluated four times if no simplification can be found, and the total number of
operations remains the same as in the previous case. The number of constraints, though, is
reduced by four.
(15)while
the integration is then made over a fourth of the pupil, the function
has to
be evaluated four times if no simplification can be found, and the total number of
operations remains the same as in the previous case. The number of constraints, though, is
reduced by four.
3. Discretization and optimization
To be suitable for computations and numerical optimizations, the equations derived previously must be converted to a discrete form.
3.1. Discretization
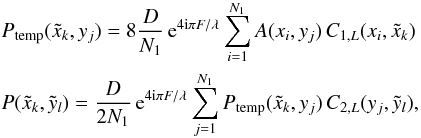
The axes in plane A are sampled with N1 points, and with N2 points in plane C. In the case of the 4QPM, and looking back at Eq. (6), this leads to writing that:
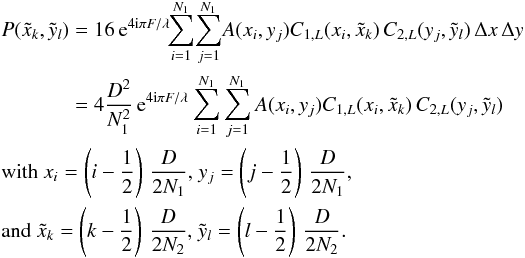 (16)Assuming
a uniform distribution of points along both the x and y
axes, Δx and Δy are replaced with
(16)Assuming
a uniform distribution of points along both the x and y
axes, Δx and Δy are replaced with
 .
The value of the electric field for the
.
The value of the electric field for the  points in
plane C is computed with a total of
points in
plane C is computed with a total of  operations.
This number can be reduced by proceeding to this integration in two successive steps:
operations.
This number can be reduced by proceeding to this integration in two successive steps:
 (17)and
the complexity becomes
(17)and
the complexity becomes  .
.
In the case of the VPM, using Eq. (11),
the integration is slightly different: 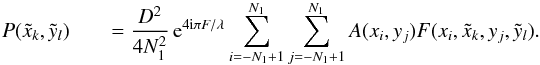 (18)Using
Eq. (15) instead of Eq. (11) does not change the complexity, which
equals 2 ×
(18)Using
Eq. (15) instead of Eq. (11) does not change the complexity, which
equals 2 ×  in both
cases. Indeed, is a
complex function, and the real and imaginary parts must be considered separately in the
optimization, which increases the number of computations by a factor two. Furthermore, the
entire pupil plane must be considered here, and four times as many points are required. It
was previously shown that the parity properties of F can be used to
compute the field using only one quadrant of the pupil, but the actual number of
computations remains the same. Finally, separating the double integral into two successive
integrals actually increases the complexity to
in both
cases. Indeed, is a
complex function, and the real and imaginary parts must be considered separately in the
optimization, which increases the number of computations by a factor two. Furthermore, the
entire pupil plane must be considered here, and four times as many points are required. It
was previously shown that the parity properties of F can be used to
compute the field using only one quadrant of the pupil, but the actual number of
computations remains the same. Finally, separating the double integral into two successive
integrals actually increases the complexity to 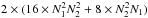 (in this case
Ptemp would be a function of three variables, and not two).
(in this case
Ptemp would be a function of three variables, and not two).
One may wonder if it would not be more efficient to compute the electric field in plane C
through two successive Fourier transforms. The total complexity would go as low as
 , where M would be the number of
points used to sample the electric field along both axes of plane B. This complexity
assumes a two-axes symmetry in the entrance pupil plane, and relies on the physics of the
VPM, so that the electric field can be computed in only one quadrant of planes A, B, and
C. The two-axes symmetry is a property shared by many telescopes such as the VLT, the
Subaru telescope, and the Gemini telescope. Thanks to the properties of the Fourier
transform, the same two-axes symmetry is found in the electric field in plane B, and the
VPM then creates in plane C an electric field whose real part presents the same symmetry,
and an imaginary part that presents a two-axes anti-symmetry. Hence, it is possible to use
these properties to compute the electric field in only one quadrant of each planes, thus
reducing the number of computations by a factor 4 in each transform.
, where M would be the number of
points used to sample the electric field along both axes of plane B. This complexity
assumes a two-axes symmetry in the entrance pupil plane, and relies on the physics of the
VPM, so that the electric field can be computed in only one quadrant of planes A, B, and
C. The two-axes symmetry is a property shared by many telescopes such as the VLT, the
Subaru telescope, and the Gemini telescope. Thanks to the properties of the Fourier
transform, the same two-axes symmetry is found in the electric field in plane B, and the
VPM then creates in plane C an electric field whose real part presents the same symmetry,
and an imaginary part that presents a two-axes anti-symmetry. Hence, it is possible to use
these properties to compute the electric field in only one quadrant of each planes, thus
reducing the number of computations by a factor 4 in each transform.
Realistic values for N1,N2 and M must be chosen to assess the interest of this method over the previous one. If the electric field is not computed explicitly, only the pupil planes must be correctly sampled. Both the 4QPM and the VPM, used with a circular clear aperture, produce ripples in the reimaged pupil plane with a periodicity that is the invert of the angular extension of the focal phase mask. Hence, if the mask extends up to Lλ/D, 2 L ripples appear in plane C. Assuming that the patterns that the apodizers produce present the same periodicity, the values of N1 and N2 must be chosen accordingly, i.e., they must be high enough to correctly sample this signal. To obey the Nyquist-Shannon sampling theorem, each period should be sampled with two points, which gives N2 = 2 × L (only one quadrant of the pupil plane is actually sampled). Thus, observing up to 32 λ/D implies that N2 must at least equal 64. It might be preferable to consider a higher number N1 of points in plane A since, when optimizing shaped pupils in 2D, the quasi-binary transmissions that are found can be rounded without changing the point-spread function (PSF) properties as long as N1 is large enough (a few hundred points for contrast as low as 10-7 and a thousand points for contrast values as low as 10-9). While algorithms exist to turn a gray apodization pattern into a binary one – as is done for example when computing microdots apodizers (Martinez et al. 2009) – a native binary solution would have the advantage of preventing any potential impact on the performance of the mask that the non-binary-to-binary conversion process would have.
If N1 = 128 and N2 = 64, the complexity is 1.6 × 10⁶ for the 4QPM and 1.3 × 10⁸ for the VPM. Choosing N1 = 512 and N2 = 64 makes it 1.9 × 10⁷ for the 4QPM and 2.1 × 10⁹ for the VPM.
If the electric field in plane B is explicitly sampled, it is important to sample each λ/D angular distance unit with a high enough number of points, as errors due to a poor sampling in plane B will propagate to plane C. Although the Nyquist-Shannon sampling theorem requires a minimum of two points per λ/D, the specificities of the VVC demand a higher number of points. It is also likely that the higher the topological charge, the higher the number of points since the phase variation across the image plane becomes steeper. In fact, in the case of a clear aperture, a minimum number of four points per λ/D is necessary to obtain contrast values down to 10-8 when the charge is 2. When the charge is twice as high, eight points are necessary to recover the same contrast.
If N1 = 128 and N2 = 64, and the same angular extension of 32 λ/D is chosen in plane B, then the complexity of this computation equals 7.3 × 10⁶ if four points are used to sample one λ/D, and it becomes 2.3 × 10⁷ if eight points are chosen instead. These numbers are 4.6 and 14.4 times as high as what was required with the 4QPM, but also about 300 and 100 times less than what would be required for the VVC if the electric field in plane C was computed directly, using Eq. (18).
3.2. Optimization model
The optimization of the pupil mask is very similar to the optimization of 2D shaped pupils, as described in Carlotti et al. (2009) and Vanderbei (2012). Though in both cases the problems are convex linear, the constraints that are specified here are not computed using Fourier transforms, but through the transforms described in Eqs. (6) and (11).
The problem consists in maximizing the total transmission of the mask
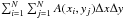 under
the following constraints set on the values of the transmission of the apodizer, and on
the amplitude of the electric field in the reimaged pupil plane, or plane C:
under
the following constraints set on the values of the transmission of the apodizer, and on
the amplitude of the electric field in the reimaged pupil plane, or plane C:
 (19)where
ΔA is the region defined by the telescope’s aperture, ΔC is the
region defined by the Lyot stop, and c measures the attenuation of the
intensity in the reimaged pupil plane in a logarithmic scale. With a clear aperture, this
attenuation factor is as small as 10-5 in the center of the pupil, although
this number depends on the size of the phase mask, and becomes increasingly smaller as the
mask becomes larger. Nonetheless, it is a good starting point for the optimization
problems that must be solved.
(19)where
ΔA is the region defined by the telescope’s aperture, ΔC is the
region defined by the Lyot stop, and c measures the attenuation of the
intensity in the reimaged pupil plane in a logarithmic scale. With a clear aperture, this
attenuation factor is as small as 10-5 in the center of the pupil, although
this number depends on the size of the phase mask, and becomes increasingly smaller as the
mask becomes larger. Nonetheless, it is a good starting point for the optimization
problems that must be solved.
The optimization model is coded using the AMPL language, and it is solved using the LOQO solver developed by Robert Vanderbei (see Vanderbei 1998).
4. Results
The implementation of the two linear transforms introduced in Eqs. (6) and (11) makes it possible to study the effect of the central obstruction on the contrast in the final image plane D, as well the impact of a smaller or larger mask size L. In the case of the 4QPM it also allows numerical optimizations to be performed efficiently.
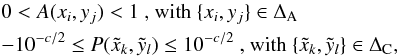
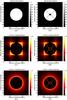 |
Fig. 2 Panels a) and b) normalized intensity in plane A for a clear and and centrally obstructed apertures. Panels c) and d) normalized intensity in plane C for the same apertures, after a 4QPM is located in plane B, that extends to 128λ/D. Panels e) and f) normalized intensity in plane C for the same apertures, after a VPM is located in plane B (its angular extension is the same). |
4.1. Impact of the central obstruction
The transforms displayed in Eqs. (6) and (11) are used here in two basic cases: one is a circular clear aperture corresponding to an off-axis telescope, and the other is an on-axis VLT-like obstructed aperture (the details of the geometry were found in Guerri et al. 2008). The normalized intensity that can be observed in the entrance pupil and the Lyot plane are displayed in Fig. 2. In both cases the linear number of points used to discretize the pupil in plane A equals 512, and the focal phase masks extend up to 128λ/D. In plane C, while all light is rejected outside the clear aperture, some light is diffracted inside the centrally obstructed aperture, reducing the attenuation of the on-axis light, as can be seen in panels (d) and (f) of Fig. 2.
The computation of the PSFs shown in Fig. 3 assumes a Lyot-stop in plane C. While two different Lyot stops must be used (one for the clear aperture, and one for the VLT-like aperture), both have a relative transmission of about 90% with respect to the main aperture. The 4QPM used with the clear aperture cancels the starlight and creates a 10-9 contrast floor. The VPM performs slightly better and creates a 10-10 contrast floor. Theoretically, both the 4QPM and the VPM completely cancel the on-axis light, and this non-infinitely low value can be explained by (a) the finite size of the phase mask and (b) the necessary discretization of the pupil.
The performance of both phase masks with the centrally obstructed aperture of the VLT is significantly poorer. Although the maximum intensity of the star is reduced by a factor 102.4 ≈ 250, the coronagraphic PSF remains only at about one to two orders of magnitude below the telescope’s PSF.
The contrast curves shown in Fig. 3 do not take into account the partial cancellation of the planet’s light when it happens to be too close to the star. Following the definition proposed in Guyon et al. (2006), the inner working angle (IWA) is defined as the distance for which no more than 50% of the planet’s light is canceled. In the case of the 4QPM, this IWA is theoretically of about 1λ/D, but the planet’s light is also attenuated if the planet is located at one of the phase transition axes of the mask, in which case the edge acts as a phase knife coronagraph, canceling 80% of the light.
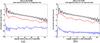 |
Fig. 3 Azimuthal averages of the PSF of a) the 4QPM coronagraph and b) the VVC, for the two apertures shown in Fig. 2. The blue line corresponds to a clear circular aperture, while the red line corresponds to the VLT aperture. In both cases, a Lyot stop with a transmission of about 90% was used to try and mitigate diffraction effects due to the finite size of the telescope aperture. |
4.2. Impact of the finite angular size of the mask
In practice, whether the 4QPM or the VPM is used, the phase mask can always only cover a finite area of the image plane. In the rigorous analytical demonstration of the nulling property of the 4QPM, it is assumed, however, that the mask covers the entire image plane, and it is thus interesting to study the impact of a finite angular size of the mask on the PSF in the final image plane. The angular size L of the mask is a parameter that must be set when computing the electric field in the Lyot plane, and Eq. (6) can be conveniently used to assess the evolution of the contrast in plane D as function of L.
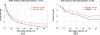 |
Fig. 4 Evolution of the mean contrast (solid black line) and the maximum contrast (dashed red line) in plane D of a 4QPM coronagraph (left) and a VVC (right) used with a circular clear aperture, for a mask radius L up to 320λ/D (for the 4QPM) and up to 64λ/D (for the VPM). An 80% transmission Lyot stop was used, and both pupil planes A and C were discretized over 4096 by 4096 points (for the 4QPM) and over 512 by 512 points (for the VPM). |
As is presented in Fig. 4, both the mean and the maximum contrasts decrease with higher values of L. In the case of the 4QPM, the diffraction effects caused by the finite size of the mask lead to a 10-5.9 maximum contrast for L = 16λ/D, a 10-8 maximum contrast for L = 48λ/D, and 10-10 maximum contrast for L ≈ 140λ/D. The case of the VPM is quite similar, although the decrease of the contrast value is less monotonous.
These values were computed assuming a clear circular aperture without a central obstruction, and without spiders. In the two pupil planes A and C, the electric field was computed over 4096 by 4096 points in the case of the 4QPM, and over 512 by 512 points in the case of the VPM (this smaller number was chosen because of the higher complexity of the computation). The mean and maximum contrast values were computed from azimuthally averaged PSFs, over an angular range going from 0 to 48λ/D for L ≤ 64, and from 0 to 0.75L otherwise (this was done to mitigate diffraction effects occurring near the outer edge of the mask). The Lyot stop was chosen in this case to have an 80% transmission. A more transmissive Lyot stop (90% transmission) leads to a similar but slower decrease, with a 10-10 maximum contrast being reached for L = 190λ/D.
4.3. Results of the optimizations
A 3.3 GHz processor out of a 24 cores machine, with a total RAM of 192 GB was used to solve the optimization problems. Since in practice this machine is shared with many users, only up to 8 GB are available for one optimization process. Because of its lower complexity, the case of the 4QPM was considered first. Five different apodizers were computed for this phase mask (see Fig. 5) and for a VLT-like aperture. In the case of the VPM, the complexity of the optimization process is not much higher, but too much RAM was required and no results have yet been obtained for this mask.
Every apodizer has been designed to attenuate the diffracted light inside the area defined by a specific Lyot stop (see Fig. 6). The five Lyot stops were computed by oversizing the central obstruction and the spiders of the telescope, while undersizing its outer diameter. To do that, an image-filtering process was used: an array describing the telescope aperture is convolved with the unit matrix. The result is a blurred image of the aperture. Rounding it creates a Lyot stop. The transmission and resolution losses are adjusted by the relative size of the unit matrix and the aperture. An array of 1024 by 1024 points was used for the aperture to accurately change the transmission in the pupil plane. The Lyot stops were then interpolated in 2D to reduce their size. The transmissions TLS of the five Lyot stops range from 59% to 83%. These transmissions are defined as the ratio of the total intensity going through the masks with the total intensity going through the initial aperture of the telescope.
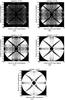 |
Fig. 5 Transmitted intensities of the five apodizers optimized for the 4QPM at the VLT and a Lyot stop with a transmission of a) 83%; b) 79%; c) 74%; d) 69%; e) 59%. White denotes a unit transmission, and black a zero transmission. |
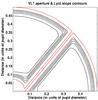 |
Fig. 6 Contours of the VLT aperture (red) and of the five Lyot stops (black) with the respective transmissions of 83%, 79%, 74%, 69%, and 59%. |
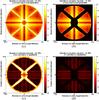 |
Fig. 7 Log scale intensities in the Lyot plane a) without the Lyot stop and without apodization; b) with the Lyot stop and without apodization; c) without the Lyot stop and with apodization; and d) with the Lyot stop and apodization. Mask #4 is used here. It is designed for an 69% transmission Lyot stop. |
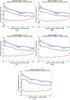 |
Fig. 8 Azimuthally averaged contrast obtained with the apodizers designed for a Lyot stop with a transmission of a) 83%; b) 79%; c) 74%; d) 69%. In each figure the blue line denotes the PSF of the telescope (including the Lyot stop), the black line corresponds to the PSF of the 4QPM without apodization, and the red line corresponds to the PSF of the apodized 4QPM. |
Indeed, each apodizer is optimized over an array of 128 by 128 pixels covering one quadrant of plane A. In every cases, the angular extension L of the phase mask is 32λ/D. The electric field in plane C is also computed over one quadrant, and with the same number of points as in plane A. An average time of a day and a half were necessary to compute each apodizer.
The effect of the apodized 4QPM on the spatial distribution of the energy density in the Lyot plane is shown in Fig. 7 for mask #4. On-axis light is concentrated outside the transmissive area of the Lyot stop and is thus almost entirely blocked by it. In contrast, in the unapodized case, light is spread in these regions and the extinction of the star is very poor.
Radial averaged profiles of the PSFs are displayed in Fig. 8 for the five apodizers (2D contrast plots were averaged azimuthally to represent in one dimension only). A contrast floor lower than 10-8 and higher than 10-10 is obtained with each mask, the lowest ones corresponding to the least transmissive Lyot stops. For comparison, the PSF of the unapodized 4QPM is also showed. A gain of four to five orders of magnitude is provided by using an apodizer.
A comparison of these results with those displayed in Fig. 4, shows clearly that the apodizer does not only help in restoring the contrast performance of the 4QPM. While a maximum contrast of 10-7 should have been obtained for mask size L of 32 λ/D, maximum contrast as low as 10-9 is seen in the PSF shown in Fig. 8 (the maximum is looked for over an angular range that extends between 0 and 24 λ/D, as in Sect. 4.2). Hence, in addition to limiting the impact of the central obstruction, the apodizer helps to mitigate the diffraction effects caused by the finite size of the phase mask.
It is important to notice that these PSFs were computed using the “raw” transmission of the apodizers. While the transmissions of the masks tend to be binary, a 5–7% Rbin fraction of the pupil area exhibits a transmission higher than 1% and lower than 99% (see Table 1). Figure 11 compares the result of two optimizations that differ by the size of the arrays used to discretize the apodizer in plane A: the first one has 128 by 128 points while the other has 256 by 256 points. The apodizers’ transmissions are similar, but there are more than three times less points with a non-binary transmission in the larger array (Rbin ≈ 1.8%). This is not unexpected as it has already been noticed in 2D shaped pupil optimization problems.
Artificially rounding the transmission of the apodizers has a significant impact on the contrast. In the case of mask #4, as displayed in Fig. 11, the contrast floor is between 10-7 and 10-6. However, the apodizer computed for the same Lyot stop transmission, but over four times as many points, gives a lower contrast that remains between 10-8 and 10-7 beyond 3λ/D, and that does not exceed 10-6.6 below this angular distance.
As is summarized in Table 1, the respective transmissions TA of the five apodizers range from 92% to 16%. These transmissions are defined in the same way as the Lyot stop transmissions were previously defined, as the ratio of the total intensity going through the apodizers with the total intensity going through the initial aperture of the telescope.
The maximum throughput Tmax of the system ranges from 64% to 5%. Tmax is not computed as the product of TLS and TA, as is the case with most coronagraphs. To do so, one must assume that the focal plane mask does not have a significant impact on the planet light transmission, which fails to be true in the case of the 4QPM. Instead, Tmax is measured by injecting an off-axis source in the instrument and measuring its attenuation in the final image plane.
Because of the phase mask, the throughput T(u,v) varies across the image plane. Its maximum, Tmax, is found by moving the planet at equal distance from the 4QPM phase transitions, hence along a diagonal. Figure 9 shows how the normalized throughput T(u,v)/Tmax changes along the diagonals of the masks, and in general in the image plane (but only in the specific case of mask #4).
As illustrated in Fig. 10, to each Lyot stop corresponds a different value of Tmax, which goes through a maximum of 64% with mask #4 (TLS = 69%). This maximum value can be roughly estimated by extrapolating from a linear fit based on the evolution of Tmax with TLS. The line that can be drawn crosses the line Tmax = TLS for TLS ≈ 68%. Since the system’s maximum throughput Tmax cannot be larger than the Lyot stop’s transmission TLS, T = 68% can be thought of as an upper-limit estimate of the maximum value of Tmax for this specific telescope architecture, and this family of Lyot stops. Still, in Fig. 10, the product of TLS and TA is reproduced as a function of TLS. It can be noticed that this product overestimates the value of Tmax for masks #1, 2, and 3 and underestimates it for masks #4 and 5.
The system’s maximum throughput Tmax is not the only metric one should refer to to evaluate the system’s performance, however. One must also consider the angular resolution of the instrument. Using the information displayed in Fig. 9 and following Guyon et al. (2006), the effective IWAs range between 0.99 and 1.37 λ/D (see Table 1). The smallest IWA corresponds to the 59% transmission Lyot stop, and the largest IWA to the 83% transmission Lyot stop.
The time required in the case of the larger array equals 118 h, which is 3.3 times longer than the time required for the smaller array. This is in accordance with our estimate of the complexity, as the ratio of the complexities is 3 in this case (N1 = 256, N2 = 128).
Main parameters of the five different apodizers optimized for a 4QPM coronagraph.
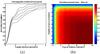 |
Fig. 9 a) Normalized transmission of the apodized 4QPM for the five different Lyot stops, and for a planet located, along the diagonal, between 0 and 8 λ/D. Sorted by increasing transmission, the curves correspond to the 83%, 79%, 74%, 59%, and 69% transmission Lyot stops. b) 2D map of the normalized transmission for mask #4 (Lyot stop transmission: 69%). |
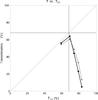 |
Fig. 10 Evolution of the system’s throughput Tmax as a function of the Lyot stop transmission TLS. The vertical and horizontal dashed lines indicate the coordinates of the intersection point between the L = LLS line and the linear trend of the four points of the solid curve plotted at the right side of the figure. The dashed curve represents the evolution of the product TLS × TA as function of TLS. |
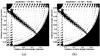 |
Fig. 11 Transmitted intensities of two apodizers optimized over arrays of different size, for the 4QPM at the VLT and a 69% transmission Lyot stop. Only one quadrant of the pupil plane is shown. The number of points in these arrays is a) 128 by 128 and b) 256 by 256. |
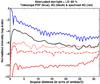 |
Fig. 12 Azimuthally averaged contrast plots obtained with the apodizer designed for a 69% transmission Lyot stop. As in Fig. 8, the blue line denotes the PSF of the telescope (including the Lyot stop) while the black line corresponds to the PSF of the 4QPM without apodization. The three red lines correspond to the PSF of the apodized 4QPM. The solid line is used for the PSF of the “raw” mask (i.e., non-binary), and the dashed and dotted lines are used for the PSFs of the binary masks computed over 256 by 256 points and 128 by 128 points. |
5. Discussion and conclusion
Both the original four-quadrant phase mask coronagraph and the VVC see their performance reduced with centrally obstructed apertures such as the VLT’s, and the contrast they provide is only 1 to 2 orders of magnitude below the PSF of the telescope. In contrast, when used with clear circular apertures, these coronagraphs could provide contrast as low as 10-10 at only 1λ/D from the star.
Solutions have been proposed in the past that consist in either using a circular subaperture, or using a two-stage optical layout. The first solution leads to a significant resolution loss and an even higher transmission loss. The second solution offers a more satisfying result, but requires twice as many optical components, which can limit the system’s performance because of alignment issues, additional wavefront aberrations, and chromaticity effects.
It was shown that optimal apodizers can help to restore the performance of these coronagraphs when they are used with an on-axis telescope, and that the diffraction effects caused by the finite size of the focal phase mask are also mitigated thanks to the apodizer. In addition to the already existing phase mask and Lyot stop, an apodizer is located in an upstream pupil plane. No other additional optical components are required. Any aperture can be used as a basis for an optimization, although symmetric apertures have the advantage of reducing the number of points and thus the complexity of the computations.
The apodizer’s transmission can be numerically optimized in 2D in the same way as for shaped pupils. However, the complexity of the problem is different whether a 4QPM or a VPM is used. Different cases require different computation methods. For the 4QPM, directly computing the electric field in the Lyot plane appears to be the better choice. Indeed, sampling errors in plane B are avoided since the electric field does not need to be computed explicitly in this plane. For the VPM, however, computing the same electric field is better done through two successive Fourier transforms (from pupil plane A to image plane B, and then to pupil plane C). While 1.5 days are necessary to compute an apodizer over a 128 by 128 matrix for the 4QPM, the same optimization would take about three to nine times longer for the VPM, depending on the sampling resolution of plane B.
The apodizers that were presented here are designed only for the 4QPM. A VLT-like aperture was chosen and different Lyot stop sizes were considered. For each Lyot-stop, an apodizer was found by solving a linear convex optimization problem. The total throughput of the system is a function of the Lyot stop’s transmission. It goes through a maximum for which an upper-limit of about 68% is found for a 68% transmission Lyot stop (and in the particular case of the VLT). In practice, i.e., when optimizing an apodizer for this specific Lyot stop, the system’s throughput is found to be 64% and is given by an apodizer with an 89% transmission, associated to a 69% transmission Lyot stop.
As observed previously with fully optimized shaped pupils, the masks that were computed tend to have a binary transmission: only 5–7% of the pupil surface has a transmission higher than 1% and lower than 99%. This decreases to 1.7% when the size of the array is doubled, from 128 by 128 to 256 by 256. It is very likely that masks optimized over even larger arrays would have an even lower non-binary transmission ratio. Computing a mask over a 512 by 512 array would take an estimated time of 15 days. For a full 2D shaped pupil optimization, array lengths of half a thousand points have proven to be long enough to obtain quasi-binary apodizers whose transmission, when artificially rounded, provides contrast down to 10-9 (Carlotti et al. 2011). Contrast values are significantly increased when artificially rounding the transmission of the apodizers: up to about 10-6 for a 128 by 128 mask, and up to about 10-7 for a 256 by 256 mask instead of a few 10-10 for mask #4. Optimizing masks over larger arrays is mandatory, and this point will be addressed in the near future, thanks to a new computer, dedicated to week-long computations.
Binary masks can efficiently be manufactured using photolithography: a thin metallic coating can be deposited on a glass substrate and then be selectively etched. The substrate adds chromaticity and wavefront aberrations. If the mask is structurally connected, it can be etched out of a thin silicon wafer coated with metal, which eliminates these disadvantages.
Gray apodizers have also been produced, either by depositing on a substrate a metallic layer with a spatially varying thickness, or by using high-energy beam-sensitive (HEBS) glass. These apodizers are considered to be too chromatic, however (Sivaramakrishnan et al. 2009).
Apart from mask #1, every mask computed for the VLT-like aperture would require the use of a substrate. While a free-standing apodizer would certainly have its advantages, the apodized coronagraphs of both SPHERE and GPI use substrate-based apodizers. As presented in Enya et al. (2008), substrate-based shaped pupils with anti-reflection coatings on both sides have achieved 8 × 10⁻⁸ contrast in the visible. SPHERE and GPI both work in the near-infrared, where, given the same surface aberrations, a substrate would create weaker wavefront aberrations than in the visible, which could potentially lead to even lower contrast values.
It may also be possible to use MEMS or MOEMS devices as adaptive binary apodizers, either in transmission (using a technology similar to the one used in JWST’s micro-shutter arrays) or in reflection (such as the micro-mirror arrays used in many video-projectors). In addition to offering substrate-free apodizers, it would also allow one to directly control the amplitude of the wavefront.
Apodizers optimized for a 4QPM could potentially complement SPHERE’s 4QPM coronagraphs, increasing the achievable contrast while offering the same very low resolution.
No apodizer has yet been optimized for the VVC. The VVC has a substantial advantage over the 4QPM, however, since it does not reduce the discovery area. Both the charge 2 VVC and the 4QPM are very sensitive to finite stellar size and jitter. This sensitivity can be reduced if a charge 4 VVC or an eight-octant mask is used instead, although the eight-octant mask reduces the discovery area even more than the 4QPM does.
There is no inherent reason that makes the optimization of apodizers for the VVC impossible. Shortening the computation time would greatly help this process, however. To that end it will be necessary to either simplify the problem further, possibly by assuming circular-symmetric apertures and apodizers, or to solve the optimization problem in a more efficient manner, for example by taking advantage of the multiple cores of a computer.
Finally, the joint optimization of the apodizer and the Lyot stop is also a possibility that will be explored. Though more computationally intensive, it would de facto maximize the transmission of the system.
See for example http://exoplanet.eu/catalog/
For the Kepler candidates, see http://archive.stsci.edu/kepler/planet_candidates.html
Acknowledgments
The author is thankful to the anonymous referee for his/her meaningful suggestions, and also to Laurent Pueyo and Dimitri Mawet for their encouragement, and for the fruitful discussions that he shared with them as well as with Mary-Ann Peters.
References
- Aime, C., Soummer, R., & Ferrari, A. 2002, A&A, 389, 334 [NASA ADS] [CrossRef] [EDP Sciences] [Google Scholar]
- Aime, C., Carlotti, A., & Ricort, G. 2007, Comptes Rendus Physique, 8, 961 [NASA ADS] [CrossRef] [Google Scholar]
- Batalha, N. M., Rowe, J. F., Bryson, S. T., et al. 2012, ApJS, submitted [arXiv:1202.5852] [Google Scholar]
- Baudoz, P., Assemat, F., Galicher, R., Baudrand, J., & Boccaletti, A. 2010, SPIE Conf. Ser., 7735 [Google Scholar]
- Beichman, C., Doyon, R., Greene, T., et al. 2010, Proc. Conf. In the Spirit of Lyot, ed. A. Boccaletti (Paris: University of Paris Diderot) [Google Scholar]
- Beuzit, J.-L., Feldt, M., Mouillet, D., et al. 2010, Proc. Conf. In the Spirit of Lyot, ed. A. Boccaletti (Paris: University of Paris Diderot) [Google Scholar]
- Boccaletti, A., Abe, L., Baudrand, J., et al. 2008, SPIE Conf. Ser., 7015 [Google Scholar]
- Borucki, W. J., Koch, D. G., Basri, G., et al. 2011, ApJ, 736, 19 [NASA ADS] [CrossRef] [Google Scholar]
- Burrows, A., Sudarsky, D., & Hubeny, I. 2006, ApJ, 650, 1140 [NASA ADS] [CrossRef] [Google Scholar]
- Carlotti, A., Ricort, G., & Aime, C. 2009, A&A, 504, 663 [NASA ADS] [CrossRef] [EDP Sciences] [Google Scholar]
- Carlotti, A., Vanderbei, R., & Kasdin, N. J. 2011, Opt. Expr., 19, 26796 [Google Scholar]
- Cavarroc, C., Amiaux, J., Baudoz, P., et al. 2008, SPIE Conf. Ser., 7010 [Google Scholar]
- Enya, K., & S. W. Group. 2011, in ASP Conf. Ser. 450, eds. J. P. Beaulieu, S. Dieters, & G. Tinetti, 181 [Google Scholar]
- Enya, K., Abe, L., Tanaka, S., et al. 2008, A&A, 480, 899 [NASA ADS] [CrossRef] [EDP Sciences] [Google Scholar]
- Galicher, R., Baudoz, P., & Baudrand, J. 2011, A&A, 530, A43 [NASA ADS] [CrossRef] [EDP Sciences] [Google Scholar]
- Gratadour, D., Rouan, D., Boccaletti, A., Riaud, P., & Clénet, Y. 2005, A&A, 429, 433 [NASA ADS] [CrossRef] [EDP Sciences] [Google Scholar]
- Guerri, G., Robbe-Dubois, S., Daban, J.-B., et al. 2008, SPIE Conf. Ser., 7014 [Google Scholar]
- Guyon, O. 2003, A&A, 404, 379 [NASA ADS] [CrossRef] [EDP Sciences] [Google Scholar]
- Guyon, O., Pluzhnik, E. A., Kuchner, M. J., Collins, B., & Ridgway, S. T. 2006, ApJS, 167, 81 [NASA ADS] [CrossRef] [MathSciNet] [Google Scholar]
- Guyon, O., Martinache, F., Belikov, R., & Soummer, R. 2010, ApJS, 190, 220 [Google Scholar]
- Hinkley, S., Oppenheimer, B. R., Zimmerman, N., et al. 2011, PASP, 123, 74 [NASA ADS] [CrossRef] [Google Scholar]
- Kasdin, N. J., Vanderbei, R. J., & Belikov, R. 2007, Comptes Rendus Physique, 8, 312 [NASA ADS] [CrossRef] [Google Scholar]
- Kenknight, C. E. 1977, Icarus, 30, 422 [NASA ADS] [CrossRef] [Google Scholar]
- Lagage, P. O., & European MIRI Team 2010, Proc. Conf. In the Spirit of Lyot, ed. A. Boccaletti (Paris: University of Paris Diderot) [Google Scholar]
- Lyot, B. 1932, Z. Astrophys., 5, 73 [NASA ADS] [Google Scholar]
- Macintosh, B. A., Graham, J. R., Palmer, D. W., et al. 2008, SPIE Conf. Ser., 7015 [Google Scholar]
- Marois, C., Macintosh, B., Barman, T., et al. 2008, Science, 322, 1348 [NASA ADS] [CrossRef] [PubMed] [Google Scholar]
- Marois, C., Zuckerman, B., Konopacky, Q. M., Macintosh, B., & Barman, T. 2010, Nature, 468, 1080 [NASA ADS] [CrossRef] [PubMed] [Google Scholar]
- Martinache, F., Guyon, O., Garrel, V., et al. 2011, SPIE Conf. Ser., 8151 [Google Scholar]
- Martinez, P., Dorrer, C., Kasper, M., Boccaletti, A., & Dohlen, K. 2009, A&A, 500, 1281 [NASA ADS] [CrossRef] [EDP Sciences] [Google Scholar]
- Mawet, D., Lenaerts, C., Moreau, V., et al. 2003, in SPIE Conf. Ser. 4860, ed. A. B. Schultz, 182 [Google Scholar]
- Mawet, D., Riaud, P., Absil, O., Baudrand, J., & Surdej, J. 2005, in SPIE Conf. Ser. 5905, ed. D. R. Coulter, 502 [Google Scholar]
- Mawet, D., Serabyn, E., Liewer, K., et al. 2009, Opt. Expr., 17, 1902 [Google Scholar]
- Mawet, D., Serabyn, E., Liewer, K., et al. 2010, ApJ, 709, 53 [NASA ADS] [CrossRef] [Google Scholar]
- Mawet, D., Murakami, N., Delacroix, C., et al. 2011, SPIE Conf. Ser., 8151 [Google Scholar]
- Murakami, N., Uemura, R., Baba, N., et al. 2008, PASP, 120, 1112 [NASA ADS] [CrossRef] [Google Scholar]
- Murakami, N., Guyon, O., Martinache, F., et al. 2010, SPIE Conf. Ser., 7735, 104 [NASA ADS] [Google Scholar]
- N’diaye, M., Dohlen, K., Cuevas, S., et al. 2012, A&A, 538, A55 [NASA ADS] [CrossRef] [EDP Sciences] [Google Scholar]
- Riaud, P., Boccaletti, A., Rouan, D., Lemarquis, F., & Labeyrie, A. 2001, PASP, 113, 1145 [NASA ADS] [CrossRef] [Google Scholar]
- Riaud, P., Boccaletti, A., Baudrand, J., & Rouan, D. 2003, PASP, 115, 712 [NASA ADS] [CrossRef] [Google Scholar]
- Roddier, F., & Roddier, C. 1997, PASP, 109, 815 [NASA ADS] [CrossRef] [Google Scholar]
- Rouan, D., Riaud, P., Boccaletti, A., Clénet, Y., & Labeyrie, A. 2000, PASP, 112, 1479 [NASA ADS] [CrossRef] [Google Scholar]
- Schultz, A. B., & Frazier, T. V. 1983, Lowell Obser. Bull., 9, 36 [NASA ADS] [Google Scholar]
- Serabyn, G., Mawet, D., & Burruss, R. 2010, BAAS, 42, 587 [NASA ADS] [Google Scholar]
- Serabyn, E., Mawet, D., Wallace, J. K., et al. 2011, SPIE Conf. Ser., 8146, 227 [Google Scholar]
- Sivaramakrishnan, A., Soummer, R., Carr, G. L., et al. 2009, SPIE Conf. Ser., 7440, 40 [NASA ADS] [Google Scholar]
- Sivaramakrishnan, A., Lafreniere, D., Tuthill, P. G., et al. 2010, Proc. Conf. In the Spirit of Lyot, ed. A. Boccaletti (Paris: University of Paris Diderot) [Google Scholar]
- Soummer, R., Dohlen, K., & Aime, C. 2003, A&A, 403, 369 [NASA ADS] [CrossRef] [EDP Sciences] [Google Scholar]
- Spergel, D., & Kasdin, J. 2001, BAAS, 33, 1431 [NASA ADS] [Google Scholar]
- Vanderbei, R. J. 1998, LOQO: An Interior Point Code For Quadratic Programming, Tech. rep., Optimization Methods and Software [Google Scholar]
- Vanderbei, R. J. 2012, Mathematical Programming Computation, 590 [Google Scholar]
- Vanderbei, R. J., Spergel, D. N., & Kasdin, N. J. 2003, ApJ, 590, 593 [NASA ADS] [CrossRef] [Google Scholar]
All Tables
Main parameters of the five different apodizers optimized for a 4QPM coronagraph.
All Figures
|
Fig. 1 Schematic drawing of the optical layout. The successive pupil and image planes A, B, C, and D are the locations of the apodizer, the phase mask, the Lyot stop, and the camera. The plano-convex lenses were chosen to denote the use of a focusing element. They could be replaced for example with achromatic doublets, spherical or off-axis parabolic mirrors. |
| In the text | |
|
Fig. 2 Panels a) and b) normalized intensity in plane A for a clear and and centrally obstructed apertures. Panels c) and d) normalized intensity in plane C for the same apertures, after a 4QPM is located in plane B, that extends to 128λ/D. Panels e) and f) normalized intensity in plane C for the same apertures, after a VPM is located in plane B (its angular extension is the same). |
| In the text | |
|
Fig. 3 Azimuthal averages of the PSF of a) the 4QPM coronagraph and b) the VVC, for the two apertures shown in Fig. 2. The blue line corresponds to a clear circular aperture, while the red line corresponds to the VLT aperture. In both cases, a Lyot stop with a transmission of about 90% was used to try and mitigate diffraction effects due to the finite size of the telescope aperture. |
| In the text | |
|
Fig. 4 Evolution of the mean contrast (solid black line) and the maximum contrast (dashed red line) in plane D of a 4QPM coronagraph (left) and a VVC (right) used with a circular clear aperture, for a mask radius L up to 320λ/D (for the 4QPM) and up to 64λ/D (for the VPM). An 80% transmission Lyot stop was used, and both pupil planes A and C were discretized over 4096 by 4096 points (for the 4QPM) and over 512 by 512 points (for the VPM). |
| In the text | |
|
Fig. 5 Transmitted intensities of the five apodizers optimized for the 4QPM at the VLT and a Lyot stop with a transmission of a) 83%; b) 79%; c) 74%; d) 69%; e) 59%. White denotes a unit transmission, and black a zero transmission. |
| In the text | |
|
Fig. 6 Contours of the VLT aperture (red) and of the five Lyot stops (black) with the respective transmissions of 83%, 79%, 74%, 69%, and 59%. |
| In the text | |
|
Fig. 7 Log scale intensities in the Lyot plane a) without the Lyot stop and without apodization; b) with the Lyot stop and without apodization; c) without the Lyot stop and with apodization; and d) with the Lyot stop and apodization. Mask #4 is used here. It is designed for an 69% transmission Lyot stop. |
| In the text | |
|
Fig. 8 Azimuthally averaged contrast obtained with the apodizers designed for a Lyot stop with a transmission of a) 83%; b) 79%; c) 74%; d) 69%. In each figure the blue line denotes the PSF of the telescope (including the Lyot stop), the black line corresponds to the PSF of the 4QPM without apodization, and the red line corresponds to the PSF of the apodized 4QPM. |
| In the text | |
|
Fig. 9 a) Normalized transmission of the apodized 4QPM for the five different Lyot stops, and for a planet located, along the diagonal, between 0 and 8 λ/D. Sorted by increasing transmission, the curves correspond to the 83%, 79%, 74%, 59%, and 69% transmission Lyot stops. b) 2D map of the normalized transmission for mask #4 (Lyot stop transmission: 69%). |
| In the text | |
|
Fig. 10 Evolution of the system’s throughput Tmax as a function of the Lyot stop transmission TLS. The vertical and horizontal dashed lines indicate the coordinates of the intersection point between the L = LLS line and the linear trend of the four points of the solid curve plotted at the right side of the figure. The dashed curve represents the evolution of the product TLS × TA as function of TLS. |
| In the text | |
|
Fig. 11 Transmitted intensities of two apodizers optimized over arrays of different size, for the 4QPM at the VLT and a 69% transmission Lyot stop. Only one quadrant of the pupil plane is shown. The number of points in these arrays is a) 128 by 128 and b) 256 by 256. |
| In the text | |
|
Fig. 12 Azimuthally averaged contrast plots obtained with the apodizer designed for a 69% transmission Lyot stop. As in Fig. 8, the blue line denotes the PSF of the telescope (including the Lyot stop) while the black line corresponds to the PSF of the 4QPM without apodization. The three red lines correspond to the PSF of the apodized 4QPM. The solid line is used for the PSF of the “raw” mask (i.e., non-binary), and the dashed and dotted lines are used for the PSFs of the binary masks computed over 256 by 256 points and 128 by 128 points. |
| In the text | |
Current usage metrics show cumulative count of Article Views (full-text article views including HTML views, PDF and ePub downloads, according to the available data) and Abstracts Views on Vision4Press platform.
Data correspond to usage on the plateform after 2015. The current usage metrics is available 48-96 hours after online publication and is updated daily on week days.
Initial download of the metrics may take a while.