Fig. 10
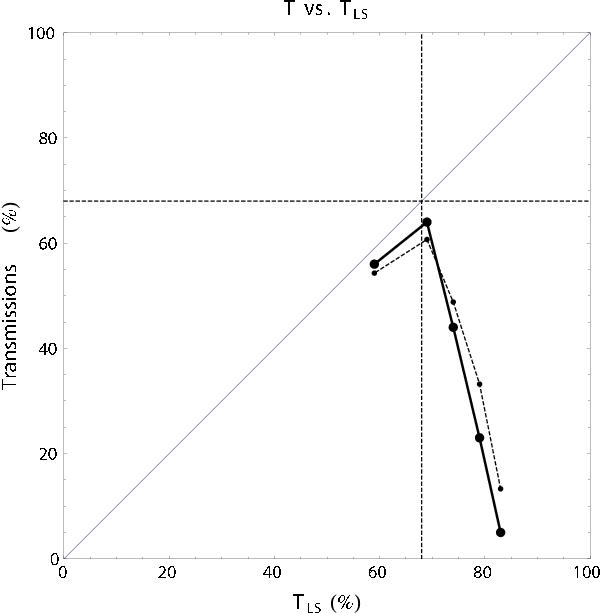
Evolution of the system’s throughput Tmax as a function of the Lyot stop transmission TLS. The vertical and horizontal dashed lines indicate the coordinates of the intersection point between the L = LLS line and the linear trend of the four points of the solid curve plotted at the right side of the figure. The dashed curve represents the evolution of the product TLS × TA as function of TLS.
Current usage metrics show cumulative count of Article Views (full-text article views including HTML views, PDF and ePub downloads, according to the available data) and Abstracts Views on Vision4Press platform.
Data correspond to usage on the plateform after 2015. The current usage metrics is available 48-96 hours after online publication and is updated daily on week days.
Initial download of the metrics may take a while.