| Issue |
A&A
Volume 551, March 2013
|
|
|---|---|---|
| Article Number | A53 | |
| Number of page(s) | 8 | |
| Section | Interstellar and circumstellar matter | |
| DOI | https://doi.org/10.1051/0004-6361/201220592 | |
| Published online | 21 February 2013 | |
Kn 26, a new quadrupolar planetary nebula⋆,⋆⋆
1
Instituto de Astrofísica de Andalucía (IAA-CSIC),
Glorieta de la Astronomía s/n,
18008
Granada,
Spain
e-mail:
This email address is being protected from spambots. You need JavaScript enabled to view it.
2
Departamento de Física Aplicada, Facultade de Ciencias, Campus
Lagoas-Marcosende s/n, Universidade de Vigo, 36310
Vigo,
Spain
e-mail:
This email address is being protected from spambots. You need JavaScript enabled to view it.
3
Consejo Superior de Investigaciones Científicas (CSIC), c/ Serrano
117, 28006
Madrid,
Spain
4
Instituto de Astronomía y Meteorología,
Av. Vallarta No. 2602, Col. Arcos
Vallarta, CP
44130
Guadalajara, Jalisco, Mexico
e-mail:
This email address is being protected from spambots. You need JavaScript enabled to view it.
5
Instituto de Astronomía, Universidad Nacional Autónoma de México,
Apdo. Postal 877, 22800
Ensenada, BC,
Mexico
e-mail:
This email address is being protected from spambots. You need JavaScript enabled to view it.
Received: 18 October 2012
Accepted: 10 January 2013
Abstract
Once classified as an emission line source, the planetary nebula (PN) nature of the source Kn 26 has only recently been recognized in digital sky surveys. To investigate the spectral properties and spatio-kinematical structure of Kn 26, we have obtained high spatial-resolution optical and near-IR narrow-band images, high-dispersion long-slit echelle spectra, and intermediate-resolution spectroscopic observations. The new data reveal an hourglass morphology typical of bipolar PNe. A detailed analysis of its morphology and kinematics discloses the presence of a second pair of bipolar lobes, making Kn 26 a new member of the subclass of quadrupolar PNe. The time lapse between the ejection of the two pairs of bipolar lobes is much shorter than their dynamical ages, implying a rapid change in the preferential direction of the central engine. The chemical composition of Kn 26 is particularly unusual among PNe, with a low N/O ratio (as for type II PNe) and a high helium abundance (as for type I PNe), although not atypical among symbiotic stars. Such an anomalous chemical composition may have resulted from the curtailment of the time in the asymptotic giant branch by the evolution of the progenitor star through a common envelope phase.
Key words: infrared: ISM / planetary nebulae: general / planetary nebulae: individual: Kn 26 / stars: AGB and post-AGB
Based on observations made with the Nordic Optical Telescope (NOT) and the William Herschel Telescope (WHT) on the island of La Palma in the Spanish Observatorio del Roque de los Muchachos of the Instituto de Astrofísica de Canarias (IAC), the 2.1-m telescope of the Observatorio Astronómico Nacional at the Sierra de San Pedro Mártir (OAN-SPM), and the 1.5-m telescope at the Observatorio de Sierra Nevada (OSN), Granada, Spain. NOT is operated jointly by Denmark, Finland, Iceland, Norway, and Sweden. WHT is operated by the Isaac Newton Group. The 2.1-m telescope at the OAN-SPM is a national facility operated by the Instituto de Astronomía of the Universidad Nacional Autónoma de México. The 1.5-m telescope at the OSN is operated by the Instituto de Astrofísica de Andalucía (IAA).The data presented here were obtained in part with ALFOSC, which is provided by the IAA under a joint agreement with the University of Copenhagen and NOTSA.
FITS files for spectra and images are available in electronic form at the CDS via anonymous ftp to cdsarc.u-strasbg.fr(130.79.128.5) or via http://cdsarc.u-strasbg.fr/viz-bin/qcat?J/A+A/551/A53
© ESO, 2013
1. Introduction
In recent years, narrow-band optical surveys of the Galaxy and near- and mid-infrared (IR) mapping of the sky have incessantly increased the population of known Galactic planetary nebulae (PNe) and their immediate precursors, post-asymptotic giant branch (AGB) stars and proto-PNe (e.g., Parker et al. 2005; Suárez et al. 2006; Miszalski et al. 2008; Viironen et al. 2009). This observational effort has allowed for better assessment of the role of PNe in the chemical enrichment of the Galaxy and of the processes of PNe formation and evolution. Incidentally, these surveys have revealed a number of PNe with very peculiar morphologies, physical structures, and evolutionary situations (e.g., Mampaso et al. 2006; Miszalski et al. 2011). These new objects are providing interesting case studies to deepen the research on the complexity of the PN phenomenon.
Properties of the narrow-band filters.
Using existing digital sky surveys, such as the POSS-I and POSS-II surveys, Jacoby et al. (2010) have presented Kn 26, a bipolar PN candidate previously known as the emission line source Lan 384 (Lanning & Meakes 2000; Eracleous et al. 2002). An inspection of the narrow-band Hα image of Kn 26 presented by Jacoby et al. (2010) suggests it has a bipolar morphology with an intriguing S-shaped point-symmetric structure, whereas the optical spectroscopy presented by Eracleous et al. (2002) supports its classification as a PN.
To confirm the PN nature of Kn 26 and to investigate its morphology, kinematics, physical conditions, and chemical abundances, we have obtained high spatial-resolution optical and near-IR narrow-band images of this nebula in conjunction with intermediate-dispersion and echelle long-slit spectroscopic observations. The analyses of these data presented in this paper allow us to conclude that Kn 26 is a true PN (PN G084.7−08.0, following the standard rules of nomenclature for PNe), whose spatio-kinematical properties make a new member of the quadrupolar class of PNe (Manchado et al. 1996). We next describe the observations in Sect. 2 and provide the main results in Sect. 3. These are discussed in Sect. 4 and summarized in Sect. 5.
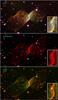 |
Fig. 1 Color-composite optical (top), near-IR (center), and optical/near-IR (bottom) narrow-band pictures of Kn 26. The narrow-band filters and colors assigned to each picture are labeled on them. The FoV is 150′′ × 85′′, whereas the insets show in greater detail the innermost 8 |
2. Observations
2.1. Narrow-band imaging
Narrow-band Hα, [N ii] λ6583, and [O iii] λ5007 images of Kn 26 were acquired on June 21, 2009 using ALFOSC (Andalucia Faint Object Spectrograph and Camera) at the 2.56 m Nordic Optical Telescope (NOT) of the Observatorio de Roque de los Muchachos (ORM, La Palma, Spain). The central wavelength (λc), bandwidth (Δλ), and transmission peaks of these filters are provided in Table 1. The EEV 2048 × 2048 CCD with pixel size 13.5 μm was used as detector and the exposure time was 900 s for each filter. The images have a plate scale of 0 184 pixel-1, a field of view (FoV) 63 × 63, and a spatial resolution of 07, as determined from the FWHM of stars in the FoV. The data were bias-subtracted and flat-fielded by twilight flats using standard IRAF1 V2.14.1 routines. Figure 1 (top) shows a color-composite picture of the optical narrow-band images of Kn 26.
Narrow-band H2 2.1218 μm, Brγ 2.1658 μm, and K continuum at 2.270 μm images of Kn 26 were obtained on June 27, 2010 using LIRIS (Long-Slit Intermediate Resolution Infrared Spectrograph, Acosta-Pulido et al. 2003) at the Cassegrain focus of the 4.2 m William Herschel Telescope (WHT) at the ORM. As for the optical filters, the central wavelength, bandwidth, and transmission peak of these filters are listed in Table 1. The detector was a 1k × 1k HAWAII array with plate scale 025 pixel-1 and the FoV 43 × 43. We obtained series of four exposures with an integration time of 60 s on each filter, for total effective exposure times of 720 s for H2 and Brγ, and 480 s for K continuum. For each series of four exposures, the nebula was placed at the center of each quadrant of the detector. The level of the emission from the sky at the time of the observation could then be assessed by directly combining the four exposures. The data were reduced using the dedicated software LIRISDR (LIRIS Data Reduction package), a pipeline for the automatic reduction of near-IR data developed within the IRAF environment. The reduction by LIRISDR includes standard and additional nonstandard steps, such as bad pixel mapping, cross-talk correction, flat-fielding, sky subtraction, removal of reset anomaly effect, field distortion correction, and final image shift and co-addition. Figure 1 (center) shows a color-composite picture of the near-IR narrow-band images of Kn 26. The lack of nebular continuum emission and the brighter emission in H2 with respect to Brγ results in the red appearance of the nebula in this picture. The spatial resolution is ≈08, as determined from the FWHM of stars in the FoV.
In addition, we registered the optical and near-IR images to compare the emission in the H2, [N ii], and [O iii] emission lines. The color composite picture is shown in Fig. 1 (bottom).
2.2. Spectroscopic observations
Intermediate-resolution long-slit spectra of Kn 26 were obtained on October 5, 2011 using the ALBIREO spectrograph at the 1.5 m telescope of the Observatorio de Sierra Nevada (OSN), Granada, Spain. A Marconi 2048 × 2048 CCD was used as a detector, in conjunction with a 400 l mm-1 grating blazed at 5500 Å. The slit length was ≈6′, and its width was set at 50 μm (≡2.5′′) to match the seeing during the observations. The binning 2 × 2 of the detector implied plate and spectral scales of 030 pix-1 and 1.89 Å pix-1, respectively. The spectral resolution was ≈4.7 Å, the wavelength uncertainty ≈1 Å, and the spectral range covered 3600−7200 Å.
Two positions with exposures of 1800 s were obtained with the slit centered on the central star and oriented along the position angles (PA) 112° and 147°, i.e., along the axis of the major bipolar lobes and along the bright S-shaped region. The observations were flux-calibrated using spectra of the spectrophotometric standard stars G 191-B2B and Hiltner 600 acquired on the same night. All spectra were bias-subtracted, flat-fielded, wavelength, and flux-calibrated following standard IRAF procedures.
Long-slit high-dispersion spectroscopy on the Hα and [N ii] λ6583 lines of Kn 26 has been acquired on June 13, 2010 using the Manchester Echelle Spectrometer (MES, Meaburn et al. 2003) mounted on the 2.1 m (f/7.5) telescope at the Observatorio Astronómico Nacional de San Pedro Mártir (OAN-SPM, Mexico). The 2048 × 2048 Thomson CCD with a pixel size of 15 μm was used, resulting in a plate scale of  and a dispersion of 0.06 Å pixel-1. The 2′′ wide slit was set across the central star and oriented along the axes of the major bipolar lobes (PA = 110°) and minor bipolar lobes (PA = 65°) with on-chip binning 1 × 1 and 2 × 2 and spectral resolutions ≈6 km s-1 and ≈12 km s-1, respectively. The spectra were wavelength-calibrated with a Th-Ar arc lamp to an accuracy of ± 1 km s-1.
3. Results
3.1. Morphology
The images of Kn 26 in Fig. 1 reveal the following morphological components: (1) the major bipolar lobes, a pair of large bipolar lobes extending ≈110′′ along PA ≈ 110°; (2) the minor bipolar lobes, a pair of small bipolar lobes extending ≈75′′ along PA ≈ 75°; and (3) a central elliptical ring. These components, marked on the sketch of Kn 26 in Fig. 2, are described in more detail next.
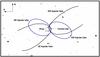 |
Fig. 2 Schematic drawing of the two pairs of bipolar lobes of Kn 26 with the different morphological components labeled on it. The eastern minor and major bipolar lobes recede from us, whereas the western lobes approach us. |
The major bipolar lobes, very prominent in [N ii] and H2, have open ends and become very faint at large distances from the nebular center. Their inner regions show a clear point-symmetric brightness distribution defined by two arcs that trace the central ring and the edges of the lobes in these innermost regions. This same point-symmetric intensity distribution is present at other locations in the lobes, very particularly in the H2 image, such as the bars located 36′′–54′′ from the nebula center that trace the southern edge of the SE bipolar lobe and northern edge of the NW lobe, and the regions at 36′′ and PA ≈ 75° and 255° that are coincident with the polar caps of the minor bipolar lobes that define the northern and southern edges of the SE and NW bipolar lobes, respectively. The Hα image presents similar structures to those observed in [N ii], whereas in the [O iii] image the point-symmetric arcs are observed as a high-excitation region (blue in Fig. 1, top) along the major nebular axis with an extent of ≈5′′ on both sides of the star at the center of the nebula.
The minor bipolar lobes have an elliptical shape (Fig. 2) and are closed, at variance with the major bipolar lobes. The NE lobe has a maximum extent from the center of 316, while the SW lobe reaches up to 347. The polar regions of these lobes are particularly bright, especially for the NE lobe. As for the major bipolar lobes, the inner regions of the minor bipolar lobes share the arcs that define the central ring.
This central ring has an elliptical shape, with its minor axis along PA ≈ 100°, i.e., similar to but not completely coincident with the orientation of the major bipolar lobes. The size of the ring is 83 × 29 in H2, 77 × 23 in [N ii], and 74 × 21 in Hα. This ring is formed by two arcs that cross at the tips of the major axis and extend along the edges of the bipolar lobes. The ring formed by these two arcs is not empty, but complex structures are detected inside this ring in different images, particularly two [N ii] and [O iii] bright knots observed on both sides of the star at the center.
Figure 1 (top) provides information on the spatial variations of the excitation in Kn 26. The major bipolar lobes present low excitation and are dominated by [N ii] emission. The H2 emission is particularly bright in the point-symmetric regions. In the minor bipolar lobes, the Hα to [N ii] line ratio is greater than in the major bipolar lobes (the green color in Fig. 1, top). Finally, higher excitation material, as revealed by the [O iii] emission, is concentrated at the center of the nebula, in a region ≈9′′ in size at the center of the nebula that extends along the axis of the major bipolar lobes.
Figure 1 (bottom) provides information about the relative distribution of molecular (H2) and ionized material ([N ii] and [O iii]) in Kn 26. The H2 emission delineates the [N ii] emission, which is always inside the nebula. H2 is particularly bright in the point-symmetric regions of the nebula, namely, in the bright point-symmetric arcs and central ring, in the two linear features at the south and north ends of the eastern and western major bipolar lobes, respectively, and at the polar regions of the minor bipolar lobes.
3.2. Kinematics
The position–velocity (PV) maps of the Hα and [N ii] λ6583 emission lines presented in Fig. 3 clearly reveal bipolar kinematics along both the major (PA 100°) and minor (PA 65°) lobes. The two pairs of bipolar lobes have different kinematical properties, but in both cases the eastern lobe recedes from us, whereas the western lobe moves away from the systemic velocity vLSR ≈ −10 km s-1 derived from our high-dispersion spectroscopic observations. The major bipolar lobes, registered by the slit along PA = 110°, are confirmed to be open, with the velocity split between the approaching and receding components increasing with distance to the central star. On the other hand, the minor bipolar lobes, registered by the slit along PA = 65°, are closed, and the velocity split also shows a smooth increase that suddenly breaks at a distance ≈13′′ from the central star, where the approaching and receding sides of the lobes converge rather abruptly.
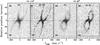 |
Fig. 3 Position–velocity maps in the Hα and [N ii] λ6583 emission lines along the two pairs of bipolar lobes at PA’s 110° (major bipolar lobes) and 65° (minor bipolar lobes). The levels of the contours overlaid on the PV maps have been selected to emphasize the kinematical structure of the emission in the brightest central regions. The dash-dotted lines overlaid on the [N ii] PV maps correspond to the synthetic emission lines derived from our simultaneous fit to the morphology and kinematics of the two pairs of bipolar lobes. |
The distortion of the velocity field of the minor bipolar lobes with respect to a classical hour-glass expansion hints at their interaction with the major bipolar lobes. The brightening of the polar caps of the minor bipolar lobes and the diffuse appearance of the Hα line in the PV map in these regions further support this interaction. We note that the minor and major bipolar lobes overlap on the regions covered by the slit along PA = 65°; however, only emission from one system of bipolar lobes is detected in this PV map. Apparently, the two pairs of bipolar lobes become a unique structure wherever they overlap; i.e., they do not intersect.
Finally, we would like to note that the contours of the brightest regions in the [N ii] PV maps have different tilts than those of the Hα line (Fig. 3). It is unclear whether this is an effect of the larger thermal broadening of the Hα line, an additional contribution from a broad Hα line at the location of the central star, or the detection of emission from the bright [N ii] knots by the side of the central star.
3.3. Physical model
We have used the visualization and modeling tool SHAPE (Steffen et al. 2011) to simultaneously fit the morphology shown in the [N ii] image and the kinematics displayed in the PV maps of the two pairs of expanding bipolar lobes of Kn 26 by adopting the simple model introduced by Solf & Ulrich (1985) to describe the structure and expansion of the nebula around the symbiotic Mira R Aqr,  (1)where ϕ is the latitude angle varying from 0° at the equator to 90° at the poles, ve and vp are the polar and equatorial velocities, respectively, and α is a parameter that determines the shape of the bipolar lobes.
We applied this model to the inner bipolar lobes and derived an inclination angle of 55° with respect to the line of sight, and polar and equatorial velocities of 160 ± 15 km s-1 and ~10 km s-1, respectively. The quality of the fit is shown by the line overplotted on the [N ii] echellogram at PA 65° (Fig. 3). As for the major bipolar lobes, a similar fit is difficult because the bipolar lobes are opened, thus providing little constraint on the polar velocity. A close inspection of the faintest emission from these bipolar lobes in the direct images and echellogram at PA 110° suggests that the lobes may close at a distance ~63′′ from the central star. Assuming this size for the major bipolar lobes, the best-fit is achieved for an inclination angle also of 55°, and polar and equatorial velocities of 300 ± 20 km s-1 and ~12 km s-1, respectively. The best fit model provides a reasonable fit of the [N ii] echellogram at PA 110° (Fig. 3) and lobe width, whereas the lobe length is uncertain.
For the minor lobes, the kinematical age of its model at a distance of d kpc is (1125 ± 100) × d yr, whereas for the major lobes only a lower limit ≳(1150 ± 100) × d yr can be derived. We note that, for the radial velocity vLSR ≈ −10 km s-1, the Galactic coordinates of Kn 26 (l = 8467, b = −796) imply a distance of 1 kpc for pure circular rotation and for a flat rotation curve. It is thus very likely that the kinematical ages of both pairs of bipolar lobes are in the range 1000−1300 yr.
3.4. Physical conditions and chemical abundances
One-dimensional spectra of the central ring and bipolar lobes of Kn 26 have been extracted from the long-slit intermediate-dispersion ALBIREO spectra (Fig. 4). These spectra include multiple oxygen, neon, sulfur, nitrogen, and argon forbidden lines, as well as hydrogen and helium recombination lines. The intrinsic line intensity ratios scaled to an arbitrary Hβ flux of 100 are listed in Table 2, where the Cardelli et al. (1989) extinction law has been used to deredden the measured line intensity ratios using the logarithmic extinction coefficient c(Hβ) = 0.30 ± 0.04 derived from the observed Hα/Hβ ratio for case B recombination. This value of the logarithmic extinction coefficient is coincident with the reddening of E(B − V) = 0.2 derived by Eracleous et al. (2002).
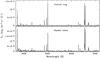 |
Fig. 4 One-dimensional spectra of the central ring (top) and bipolar lobes (bottom) of Kn 26. |
Intrinsic line intensity ratios.
The line ratios listed in Table 2 for the central ring are generally consistent with those presented by Eracleous et al. (2002), but we note that the intensity ratio of the [S ii] λλ6716, 6731 lines in our spectrum is close to six times lower. An inspection of the spectrum of Lan 384 presented by Eracleous et al. (2002) suggests that the emission line strengths for the [S ii] λλ6716, 6731 lines listed in their Table 3 are erroneous. We also notice that the [O iii] λ5007/Hβ and He iiλ4686/Hβ intrinsic intensity ratios that can be derived from the emission line strengths listed in Table 3 of Eracleous et al. (2002), ≈5.0 and ≈0.6, respectively, imply higher excitation than that of our spectrum of the central ring of Kn 26 (≈4.0 and ≈0.26, respectively). These differences reflect the higher excitation of the central regions of Kn 26 along the axis of the major bipolar lobes (see Fig. 1 (top)), which were primarily registered by the long-slit used by Eracleous et al. (2002) in their spectroscopic observations. At any rate, the relatively high [O iii] λ5007/Hβ and He iiλ4686/Hβ intrinsic intensity ratios found in both studies are typical of PNe rather than H ii regions.
The nebular analysis software ANNEB (Olguín et al. 2011), which integrates the NEBULAR package of IRAF/STSDAS (Shaw & Dufour 1995), was used to derive the physical conditions and nebular abundances of Kn 26 listed in Table 3. The NEBULAR package uses a five-level atom approximation to compute the electron temperature, density, and ionic abundances of nebular low-density gas for the most important heavy atoms. The abundances of ions of helium were derived following the method described by Vázquez et al. (1998), including a correction of collisional effects (Clegg 1987; Benjamin et al. 1999). Since only one or a few ionization stages of heavy elements are observed in the optical spectrum, ionization correction factors have been adopted to compute the elemental abundances (Kingsburgh & Barlow 1994).
Physical conditions and abundances of the central ring.
The electron density-sensitive ratio [S ii] λ6716/[S ii] λ6731 implies a low density for the nebula, ≈360 cm-3. Such low electron density, typical of the bipolar lobes of PNe, supports the idea that the apparent ring around the central star is not a real, dense ring, but an effect caused by the projection of the bipolar lobe edges. The electron temperature derived from the [N ii] emission lines, ≈9900 K, is notably lower than the temperature of 15 000 K derived by Eracleous et al. (2002) from the [O iii] emission lines2. Since our slit maps regions of lower excitation than the one used by Eracleous et al. (2002), the temperature of 9900 K has been used to determine the ionic abundances of the central region of Kn 26 listed in Table 3. Compared to other PNe, the chemical abundances of Kn 26 place it among the type I PNe for its high He/H ratio, but its N/O ratio is low for PNe of this type, which designates it as a type II PNe3 (Peimbert 1978). The Ne, S, and Ar to O ratios do not show any obvious abundance anomaly with respect to other PNe (Kwitter et al. 2003; Henry et al. 2004). We emphasize that if the higher electron temperature derived by Eracleous et al. (2002) were to be used, then the helium abundances would increase by 5%. Furthermore, the He+/H+ abundances implied by the line strength of He i λ5876 Å for the bipolar lobes is also high, 0.20 ± 0.03. We are thus confident of the determination of the helium abundances of Kn 26.
3.5. The central star of Kn 26
The star Lan 384 is detected in all narrow-band images of Kn 26 inside the elliptical ring-like structure at its center (Fig. 1). Its optical ALBIREO spectrum and spectral energy distribution (SED) additionally including available optical and 2MASS and WISE IR photometric measurements (Fig. 5) show that the flux of the star raises bluewards from the near-IR J and H bands to the bluest region of the optical spectrum, in agreement with Lanning & Meakes (2000), who first recognized that Lan 384 is a blue star. The location of Lan 384 at the center of Kn 26 and its blue color strongly suggest that it is indeed the central star of the PN. Paradoxically, the star is not located exactly at the center of this ring, as clearly revealed by the insets in the images shown in Fig. 1. We measure a displacement of the central star of Kn 26 by ≈09 along the direction of the ring’s major axis at PA ≈ 10°.
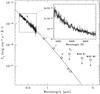 |
Fig. 5 Spectral energy distribution of the central star of Kn 26 including the optical ALBIREO spectrum (histogram) and broad-band optical, near-IR, and WISE W1 3.4 μm and W2 4.6 μm photometric measurements (diamonds). The optical ALBIREO spectrum is shown in further detail in the inset. In both plots, the smooth solid line represents the best fit to the optical spectrum by a white dwarf with temperature 70 000 K extincted by AV = 0.65 mag ≡ c(Hβ) = 0.30. As discussed in the text, the emission excess in the 2MASS Ks and WISE W1 and W2 bands with respect to these two fits is due to the contribution of nebular emission to these bands, and thus they should be regarded as upper limits of the stellar emission. |
The 2MASS Ks and WISE W1 (3.4 μm) and W2 (4.6 μm) bands imply an obvious near-IR excess in the SED of Lan 384. An inspection of these images, however, reveals that these photometric measurements are contaminated by extended nebular emission. Using 2MASS Ks photometric measurements of the stars in the field of view, we have calibrated our narrow-band K continuum image and derived a flux density for Lan 384 in this band that is about six times lower than implied from the 2MASS Ks magnitude. Contrary to the 2MASS Ks photometric measurement, the flux density in the Kc filter follows a similar decline to what is shown by the 2MASS J and H bands.
The available data can be used to estimate the effective temperature of Lan 384. In the spectral range covered by the SED in Fig. 5, the spectrum of the central star of a PN can be described by a simple black-body model. Adopting a color excess of E(B − V) = 0.2, which is consistent with the optical extinction of the nebular spectrum derived in the previous section (but also by Eracleous et al. 2002) and the extinction law of Cardelli et al. (1989), the effective temperature of a black-body that best fits the optical spectrum is ~70 000 K (solid line in the inset of Fig. 5). This model also provides a reasonable description of the photometric measurements in the B, I, J, H, and Kc bands, and its temperature is consistent with the detection of the nebular He ii λ4686 Å emission line in the nebula, implying that about 25% of helium is doubly ionized in the central regions of Kn 26 (Table 3), which requires effective temperatures ≳60 000 K (e.g., Pottasch 1984). We note, however, that this temperature should be regarded as a rough estimate because the limited coverage in the blue region of the spectrum used to carry out this fit. Dedicated UV and high-resolution optical spectrophotometric observations of Lan 384 would be very valuable for determining its effective temperature more reliably.
4. Discussion
The spectroscopic information, excitation, presence of a hot central star, morphology, and physical structure clearly confirm the nature of PN of the nebula Kn 26. Therefore, we propose it be identified as PN G084.7−08.0 following the standard rules of nomenclature for these objects.
The morphological subclass of quadrupolar PNe was introduced by Manchado et al. (1996) to describe objects that show one single equatorial waist and two pairs of bipolar lobes with symmetry axes oriented in different directions on the plane of the sky. Originally this subclass included K 3-24, M 1-75, and M 2-46, and very likely M 3-28 and M 4-14. Since then, the sample of quadrupolar PNe has increased with time up to ten (Manchado et al. 1996; Guerrero & Manchado 1998; Cuesta & Phillips 2000; Mampaso et al. 2006; Vázquez et al. 2008; Hsia et al. 2010, this paper), but there are certainly more because some PNe are prone to being classified as quadrupolar (e.g., NGC 4361 and NGC 6072, Muthu & Anandarao 2001; Kwok et al. 2010), whereas other morphological subclasses are closely related (e.g., the Starfish Nebulae, Sahai 2000). To date, only one proto-PN, IRAS 19475+3119, has been reported as having a quadrupolar morphology (Sahai et al. 2007).
The different orientations of the two pairs of bipolar lobes in quadrupolar PNe has been kinematically confirmed to occur along the line of sight for M 2-46 (Manchado et al. 1996), NGC 6881 (Guerrero & Manchado 1998), NGC 6309 (Vázquez et al. 2008), and M 1-75 (Santander-García et al. 2010). The change in the direction of the symmetry axis immediately suggests the rotation of the engine collimating the bipolar outflow that shapes the bipolar lobes. Since this change in direction can be naturally ascribed to the precession of a binary system, quadrupolar PNe have been considered archetypes of PNe formed after the evolution of the central star in a binary system (Manchado et al. 1996).
In a review of the properties of a sample of quadrupolar PNe, Mampaso et al. (2006) conclude that there is little direct evidence of detecting binarity among these sources, which is otherwise a common problem for any search for binarity among PNe (De Marco 2009). One possible exception is the central star of IPHAS PN-1, whose near-IR excess provides tantalizing evidence of a binary system (Mampaso et al. 2006). The 2MASS Ks and WISE W1 and W2 photometric measurements of Lan 384 suggest near-IR excess (Fig. 5), but a careful examination of the images led us to conclude that these photometric data are contaminated by extended nebular emission. A more accurate determination of the star flux using our K continuum image confirms that its emission level is consistent with the Rayleigh-Jeans tail of a black-body spectral distribution. Intriguingly, the central star of Kn 26 is clearly misplaced with respect to the center of the ring-like feature. Central stars displaced from the center along the minor axis of the shell are observed in many PNe (e.g., MyCn 18 and Hu 2-1; Sahai et al. 1999; Miranda et al. 2001) and can be interpreted as evidence for a binary central star (Soker et al. 1998).
Mampaso et al. (2006) also investigated the nebular abundances of their sample of quadrupolar PNe. They conclude that these sources show a wide variety of chemical abundances that generally do not match the predictions for the surface chemical enrichment of single central stars (Marigo et al. 2003). The nebular chemical abundances of Kn 26 do not match those predictions either. The abundances of oxygen, nitrogen, neon, and other heavy elements are consistent with those of the Sun and the solar neighborhood (Asplund et al. 2009; Nieva & Przybilla 2012); i.e., they do not seem to reflect a peculiar chemical enrichment. Moreover, the N/O ratio is low, ≈0.34, typical of type II PNe. In contrast, the helium abundances of Kn 26 are relatively high, with He/H ≈ 0.15, which is more common among type I PNe. Low values of the N/O ratio and high helium abundances are not typically seen in PNe, even in those exhibiting a bipolar morphology (Stanghellini et al. 2006), but exceptions can be found in the literature (e.g., the sample of PNe towards the Galactic bulge described by Escudero & Costa 2001). Symbiotic stars use to present extremely high helium abundances and low N/O ratios (e.g., Luna & Costa 2005) since the increased mass-loss caused by the binary companion interactions can curtail the dredge-up of carbon and nitrogen to the envelope, affecting the surface chemical enrichment (Lü et al. 2008). We propose that similar processes may have occurred in Kn 26, shortening the AGB evolution of its progenitor and rapidly stripping the stellar envelope to show helium-rich regions.
The two pairs of bipolar lobes are interwoven in such a way that the small bipolar lobes can be described as a protuberance of the surface of the major bipolar lobes. This noticeable difference in size between the two pairs of bipolar lobes of Kn 26 seems to imply a significant time lapse between them, even though they have very similar kinematical ages. We can envisage the large bipolar lobes forming first, and then, shortly afterwards, a bipolar ejection along a different direction would have blown sections of the inner regions of the large bipolar lobes to create the minor bipolar lobes. The inner lobes would have initially expanded into a medium already evacuated by the large bipolar lobes, but then they have interacted with the large bipolar lobes walls, resulting in the brightening of the emission and distorted velocity field at the tips of the minor bipolar lobes. At any rate, the time lapse between the ejection of each pair of bipolar lobes is presumably much shorter than the kinematical age of the lobes, i.e., 1100 × d yr. There are other quadrupolar PNe (e.g., M 1-75, Santander-García et al. 2010) where the two pairs of bipolar lobes formed in a simultaneous ejection. This should also certainly be the case for the proto-PN IRAS 19475+3119, because its young age and similar size of the bipolar lobes necessarily imply a small time lapse between the two pairs of bipolar lobes (Sahai et al. 2007). On the other hand, there are quadrupolar PNe (e.g., M 2-46, Manchado et al. 1996) for which the time lapse between ejections can reach a few thousand years.
5. Conclusions
We have used optical and near-IR narrow-band images and optical intermediate- and high-dispersion spectroscopic observations to investigate the physical structure and chemical abundances of Kn 26. The morphological and kinematical information gathered by these observations reveal that Kn 26 is a quadrupolar PN; i.e., it has two pairs of bipolar lobes.
The two pairs of bipolar lobes have very similar kinematical ages, although the larger size of the major bipolar lobes and the evidence of interaction at the tips of the minor bipolar lobes indicate that the latter formed during a second bipolar ejection. This second ejection was probably close in time to the first one that formed the major bipolar lobes, implying a rapid change in the referential direction of the collimating mechanism.
The chemical abundances of Kn 26 are unusual, with an N/O ratio typical of type II PNe, but a high helium abundance typical of type I PNe. These chemical abundances cannot be easily reproduced by models of single star evolution, but seem to be typical of symbiotic stars. We suggest that a companion star could indeed shorten the AGB evolution of the progenitor star of Kn 26 and produce the anomalous chemical abundances after going through a common envelope phase; however, no evidence of a companion star is provided by the optical and IR SED of the central star.
The comparison of Kn 26 with other quadrupolar PNe implies a wide variety of properties. The time lapse between the ejection of the two pairs of bipolar lobes may be short, almost coeval, or longer than the dynamical age of the bipolar lobes. The chemical abundances are also very different among the members of this group, suggesting different progenitors or evolutionary paths. These results confirm previous conclusions that the subclass of quadrupolar PNe is a rich phenomenon that is far from simple.
IRAF is distributed by the National Optical Astronomy Observatory, which is operated by the Association of Universities for Research in Astronomy, Inc., under cooperative agreement with the National Science Foundation.
Unfortunately, we cannot reproduce the determination of this temperature because the notable brightness of the Hg i λ4458 Å sky line at OSN, combined with the ≈4.7 Å spectral resolution of our spectra, precludes an accurate measurement of the intensity of the coronal line of [O iii] at 4363 Å.
A type III classification is precluded because the peculiar velocity of Kn 26; i.e., the difference between its radial velocity and that expected on the basis of a pure circular motion around the Galactic center for sensible distances in the range 1–6 kpc is smaller than 60 km s-1.
Acknowledgments
M.A.G., L.F.M. and G.R.-L. are partially funded by grant AYA2008-01934 of the Spanish Ministerio de Ciencia e Innovación (MICINN), which includes FEDER funds. R.V., M.A.G., and G.R.-L. acknowledge support by grant IN109509 (PAPIIT-DGAPA-UNAM). M.A.G. also acknowledges support from grant AYA 2011-29754-C03-02, and L.F.M. acknowledges partial support from grant AYA2011-30228-C03.01 of the Spanish MINECO, and grant IN845B-2010/061 of Xunta de Galicia, all of them partially funded by FEDER funds. G.R.-L. acknowledges support from CONACyT (grant 177864) and PROMEP (Mexico). Finally, we would like to thank the OAN-SPM staff and the CATT for time allocation, L. Olguín for fruitful discussion and assistance in the use of the ANNEB package, and an anonymous referee whose comments helped us in the analysis and interpretation of the nebular spectrum of Kn 26.
References
- Acosta Pulido, J. A., Ballesteros, E., Barreto, M., et al. 2003, ING Newslett., 7, 15 [Google Scholar]
- Asplund, M., Grevesse, N., Sauval, A. J., & Scott, P. 2009, ARA&A, 47, 481 [NASA ADS] [CrossRef] [Google Scholar]
- Benjamin, R. A., Skillman, E. D., & Smits, D. P. 1999, ApJ, 514, 307 [NASA ADS] [CrossRef] [Google Scholar]
- Cardelli, J. A., Clayton, G. C., & Mathis, J. S. 1989, ApJ, 345, 245 [NASA ADS] [CrossRef] [Google Scholar]
- Clegg, R. E. S. 1987, MNRAS, 229, 31 [NASA ADS] [CrossRef] [Google Scholar]
- Cuesta, L., & Phillips, J. P. 2000, ApJ, 543, 754 [NASA ADS] [CrossRef] [Google Scholar]
- De Marco, O. 2009, PASP, 121, 316 [NASA ADS] [CrossRef] [Google Scholar]
- Eracleous, M., Wade, R. A., Mateen, M., & Lanning, H. H. 2002, PASP, 114, 207 [NASA ADS] [CrossRef] [Google Scholar]
- Escudero, A. V., & Costa, R. D. D. 2001, A&A, 380, 300 [NASA ADS] [CrossRef] [EDP Sciences] [Google Scholar]
- Guerrero, M. A., & Manchado, A. 1998, ApJ, 508, 262 [NASA ADS] [CrossRef] [Google Scholar]
- Henry, R. B. C., Kwitter, K. B., & Balick, B. 2004, AJ, 127, 2284 [NASA ADS] [CrossRef] [Google Scholar]
- Hsia, C.-H., Kwok, S., Zhang, Y., Koning, N., & Volk, K. 2010, ApJ, 725, 173 [NASA ADS] [CrossRef] [Google Scholar]
- Jacoby, G. H., Kronberger, M., Patchick, D., et al. 2010, PASA, 27, 156 [NASA ADS] [CrossRef] [Google Scholar]
- Kingsburgh, R. L., & Barlow, M. J. 1994, MNRAS, 271, 257 [NASA ADS] [CrossRef] [Google Scholar]
- Kwitter, K. B., Henry, R. B. C., & Milingo, J. B. 2003, PASP, 115, 80 [NASA ADS] [CrossRef] [Google Scholar]
- Kwok, S., Chong, S.-N., Hsia, C.-H., Zhang, Y., & Koning, N. 2010, ApJ, 708, 93 [NASA ADS] [CrossRef] [Google Scholar]
- Lanning, H. H., & Meakes, M. 2000, PASP, 112, 251 [NASA ADS] [CrossRef] [Google Scholar]
- Lü, G., Zhu, C., Han, Z., & Wang, Z. 2008, ApJ, 683, 990 [NASA ADS] [CrossRef] [Google Scholar]
- Luna, G. J. M., & Costa, R. D. D. 2005, A&A, 435, 1087 [NASA ADS] [CrossRef] [EDP Sciences] [Google Scholar]
- Mampaso, A., Corradi, R. L. M., Viironen, K., et al. 2006, A&A, 458, 203 [NASA ADS] [CrossRef] [EDP Sciences] [Google Scholar]
- Manchado, A., Stanghellini, L., & Guerrero, M. A. 1996, ApJ, 466, L95 [NASA ADS] [CrossRef] [Google Scholar]
- Marigo, P., Bernard-Salas, J., Pottasch, S. R., Tielens, A. G. G. M., & Wesselius, P. R. 2003, A&A, 409, 619 [NASA ADS] [CrossRef] [EDP Sciences] [Google Scholar]
- Meaburn, J., López, J. A., Gutiérrez, L., et al. 2003, RMxAA, 39, 185 [NASA ADS] [Google Scholar]
- Miranda, L. F., Torrelles, J. M., Guerrero, M. A., Vázquez, R., & Gómez, Y. 2001, MNRAS, 321, 487 [NASA ADS] [CrossRef] [Google Scholar]
- Miszalski, B., Parker, Q. A., Acker, A., et al. 2008, MNRAS, 384, 525 [NASA ADS] [CrossRef] [Google Scholar]
- Miszalski, B., Corradi, R. L. M., Boffin, H. M. J., et al. 2011, MNRAS, 413, 1264 [NASA ADS] [CrossRef] [Google Scholar]
- Muthu, C., & Anandarao, B. G. 2001, AJ, 121, 2106 [NASA ADS] [CrossRef] [Google Scholar]
- Nieva, M.-F., & Przybilla, N. 2012, A&A, 539, A143 [NASA ADS] [CrossRef] [EDP Sciences] [Google Scholar]
- Olguín, L., Vázquez, R., Contreras, M. E., & Jiménez, M. Y. 2011, RMxAC, 40, 193 [NASA ADS] [Google Scholar]
- Parker, Q. A., Phillipps, S., Pierce, M. J., et al. 2005, MNRAS, 362, 689 [NASA ADS] [CrossRef] [Google Scholar]
- Peimbert, M. 1978, in Planetary Nebulae, Observations and Theory (Dordrecht: D. Reidel Publishing Co.), ed. Y. Terzian, Proc. IAU Symp., 76, 215 [Google Scholar]
- Pottasch, S. R. 1984, Planetary Nebulae: A Study of Late Stages of Stellar Evolution, Astrophys. Space Sci. Lib., 107 [Google Scholar]
- Sahai, R. 2000, ApJ, 537, L43 [NASA ADS] [CrossRef] [Google Scholar]
- Sahai, R., Dayal, A., Watson, A. M., et al. 1999, AJ, 118, 468 [NASA ADS] [CrossRef] [Google Scholar]
- Sahai, R., Sánchez Contreras, C., Morris, M., & Claussen, M. 2007, ApJ, 658, 410 [NASA ADS] [CrossRef] [Google Scholar]
- Santander-García, M., Rodríguez-Gil, P., Hernandez, O., et al. 2010, A&A, 519, A54 [NASA ADS] [CrossRef] [EDP Sciences] [Google Scholar]
- Solf, J., & Ulrich, H. 1985, A&A, 148, 274 [NASA ADS] [Google Scholar]
- Shaw, R. A., & Dufour, R. J. 1995, PASP, 107, 896 [NASA ADS] [CrossRef] [Google Scholar]
- Soker, N., Rappaport, S., & Harpaz, A. 1998, ApJ, 496, 842 [NASA ADS] [CrossRef] [Google Scholar]
- Stanghellini, L., Guerrero, M. A., Cunha, K., Manchado, A., & Villaver, E. 2006, ApJ, 651, 898 [NASA ADS] [CrossRef] [Google Scholar]
- Steffen, W., Koning, N., Wenger, S., Morisset, C., & Magnor, M. 2011, IEEE Trans. Visualiz. Comput. Graph., 17, 454 [Google Scholar]
- Suárez, O., García-Lario, P., Manchado, A., et al. 2006, A&A, 458, 173 [NASA ADS] [CrossRef] [EDP Sciences] [Google Scholar]
- Vázquez, R., Kingsburgh, R. L., & López, J. A. 1998, MNRAS, 296, 564 [NASA ADS] [CrossRef] [Google Scholar]
- Vázquez, R., Miranda, L. F., Olguín, L., et al. 2008, A&A, 481, 107 [NASA ADS] [CrossRef] [EDP Sciences] [Google Scholar]
- Viironen, K., Mampaso, A., Corradi, R. L. M., et al. 2009, A&A, 502, 113 [NASA ADS] [CrossRef] [EDP Sciences] [Google Scholar]
All Tables
All Figures
|
Fig. 1 Color-composite optical (top), near-IR (center), and optical/near-IR (bottom) narrow-band pictures of Kn 26. The narrow-band filters and colors assigned to each picture are labeled on them. The FoV is 150′′ × 85′′, whereas the insets show in greater detail the innermost 8 |
| In the text | |
|
Fig. 2 Schematic drawing of the two pairs of bipolar lobes of Kn 26 with the different morphological components labeled on it. The eastern minor and major bipolar lobes recede from us, whereas the western lobes approach us. |
| In the text | |
|
Fig. 3 Position–velocity maps in the Hα and [N ii] λ6583 emission lines along the two pairs of bipolar lobes at PA’s 110° (major bipolar lobes) and 65° (minor bipolar lobes). The levels of the contours overlaid on the PV maps have been selected to emphasize the kinematical structure of the emission in the brightest central regions. The dash-dotted lines overlaid on the [N ii] PV maps correspond to the synthetic emission lines derived from our simultaneous fit to the morphology and kinematics of the two pairs of bipolar lobes. |
| In the text | |
|
Fig. 4 One-dimensional spectra of the central ring (top) and bipolar lobes (bottom) of Kn 26. |
| In the text | |
|
Fig. 5 Spectral energy distribution of the central star of Kn 26 including the optical ALBIREO spectrum (histogram) and broad-band optical, near-IR, and WISE W1 3.4 μm and W2 4.6 μm photometric measurements (diamonds). The optical ALBIREO spectrum is shown in further detail in the inset. In both plots, the smooth solid line represents the best fit to the optical spectrum by a white dwarf with temperature 70 000 K extincted by AV = 0.65 mag ≡ c(Hβ) = 0.30. As discussed in the text, the emission excess in the 2MASS Ks and WISE W1 and W2 bands with respect to these two fits is due to the contribution of nebular emission to these bands, and thus they should be regarded as upper limits of the stellar emission. |
| In the text | |
Current usage metrics show cumulative count of Article Views (full-text article views including HTML views, PDF and ePub downloads, according to the available data) and Abstracts Views on Vision4Press platform.
Data correspond to usage on the plateform after 2015. The current usage metrics is available 48-96 hours after online publication and is updated daily on week days.
Initial download of the metrics may take a while.