Fig. 3
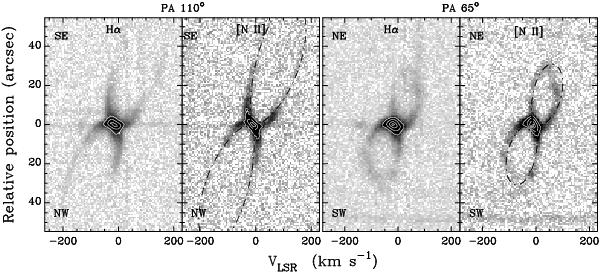
Position–velocity maps in the Hα and [N ii] λ6583 emission lines along the two pairs of bipolar lobes at PA’s 110° (major bipolar lobes) and 65° (minor bipolar lobes). The levels of the contours overlaid on the PV maps have been selected to emphasize the kinematical structure of the emission in the brightest central regions. The dash-dotted lines overlaid on the [N ii] PV maps correspond to the synthetic emission lines derived from our simultaneous fit to the morphology and kinematics of the two pairs of bipolar lobes.
Current usage metrics show cumulative count of Article Views (full-text article views including HTML views, PDF and ePub downloads, according to the available data) and Abstracts Views on Vision4Press platform.
Data correspond to usage on the plateform after 2015. The current usage metrics is available 48-96 hours after online publication and is updated daily on week days.
Initial download of the metrics may take a while.