Fig. 8
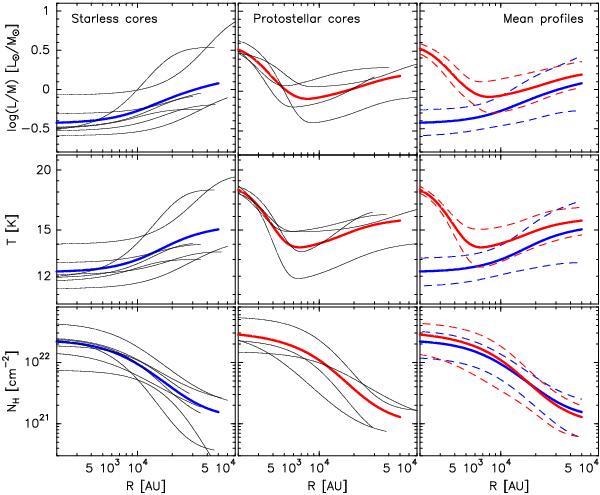
Radially averaged column density profiles (bottom), LoS-averaged dust temperature (center), and luminosity-to-mass ratio profiles (top), for individual sources (thin black solid lines) as well as mean profiles (thick lines) of starless and protostellar cores. Note that the latter ones are fits to the mean profiles, while we list the means of the indivudual profile parameters in Table 5, which is not exactly the same. Thin lines in the rightmost panels indicate the 1σ uncertainty ranges of the mean profiles.
Current usage metrics show cumulative count of Article Views (full-text article views including HTML views, PDF and ePub downloads, according to the available data) and Abstracts Views on Vision4Press platform.
Data correspond to usage on the plateform after 2015. The current usage metrics is available 48-96 hours after online publication and is updated daily on week days.
Initial download of the metrics may take a while.