Fig. 6
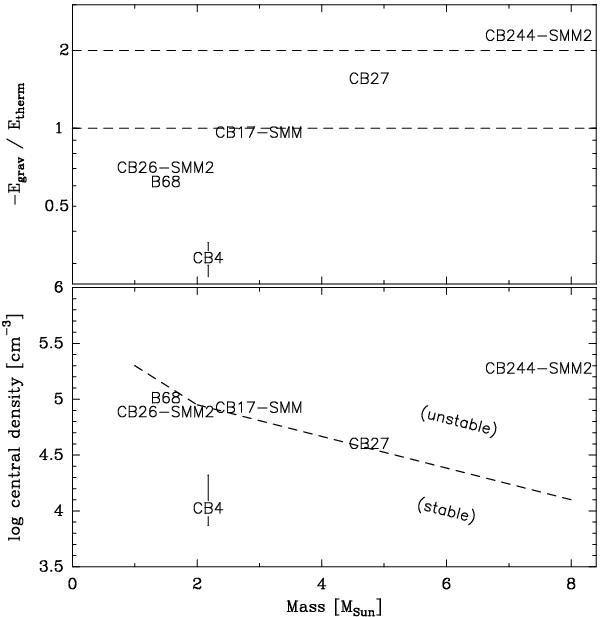
Stability of starless cores. Top: ratio of gravitational potential to thermal kinetic energy vs. total gas mass (1.36 × MH), both integrated within the N2 column density contours (Table 5). The lower dashed horizontal line marks the bounding limit of − Egrav/Etherm = 1, while the upper line marks the state of virialization at − Egrav/Etherm = 2. Bottom: estimated central density (see Sect. 5.5) vs. total gas mass for the same starless cores. The dashed line marks the maximum stable density of a pressure-supported, self-gravitating modified (nonisothermal) BES (with photelectric heating at the core boundary taken into account) as calculated by Keto & Caselli (2008, their Fig. 14). Typical estimated uncertainties on the source parameters are indicated as Y error bars on CB 4. The uncertainty in mass corresponds to the size of the label.
Current usage metrics show cumulative count of Article Views (full-text article views including HTML views, PDF and ePub downloads, according to the available data) and Abstracts Views on Vision4Press platform.
Data correspond to usage on the plateform after 2015. The current usage metrics is available 48-96 hours after online publication and is updated daily on week days.
Initial download of the metrics may take a while.