Fig. 5
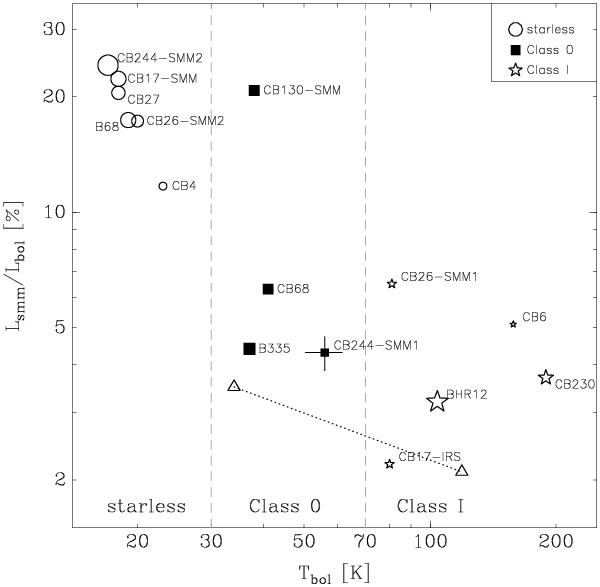
Lbol/Lsubmm ratio vs. bolometric temperature of the globule cores (see Table 6 and Sect. 5.4). The size of the symbols scales with the peak column density of the respective sources. Error bars on CB 244 - SMM1 illustrate the 10% relative uncertainity on both values (Sect. 5.4). The “classical” Tbol boundaries for Class 0 protostars are indicated by the vertical dashed lines. The two triangles, connected by a dotted line, represent one synthetic protostar-envelope system taken from (Robitaille et al. 2006), once seen close to edge-on (Tbol = 34 K) and once seen nearly pole-on into the outflow cavity (Tbol = 119 K; see discussion in Sect. 5.4).
Current usage metrics show cumulative count of Article Views (full-text article views including HTML views, PDF and ePub downloads, according to the available data) and Abstracts Views on Vision4Press platform.
Data correspond to usage on the plateform after 2015. The current usage metrics is available 48-96 hours after online publication and is updated daily on week days.
Initial download of the metrics may take a while.