Fig. 4
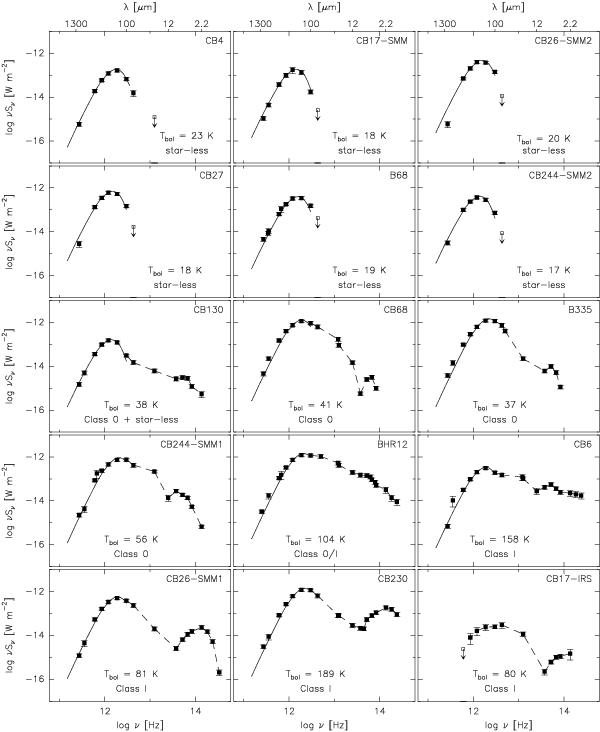
Integrated spectral energy distributions of the dense cores and embedded sources listed in Table 6. Fluxes are integrated within the N1′ contour (Eq. (10)), as are the core masses and luminosities listed in Table 6. Solid lines between 3 mm and 100 μm mark the modified blackbody fits to the data points, while dashed lines only represent a logarithmic interpolation of the data points shortward of 100 μm (see Sect. 5.3).
Current usage metrics show cumulative count of Article Views (full-text article views including HTML views, PDF and ePub downloads, according to the available data) and Abstracts Views on Vision4Press platform.
Data correspond to usage on the plateform after 2015. The current usage metrics is available 48-96 hours after online publication and is updated daily on week days.
Initial download of the metrics may take a while.