Fig. 3
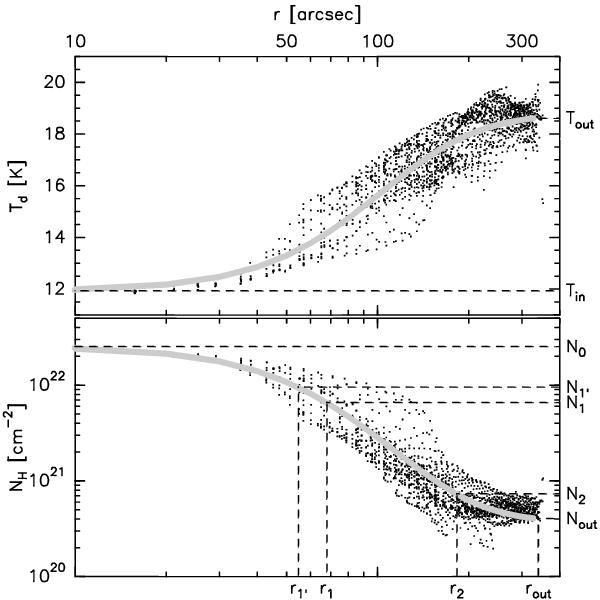
Radial profiles of column density and LoS-averaged dust temperature of B 68 (cf. Fig. 9 of Nielbock et al. 2012 for the ray-tracing results of the same data). Small black dots show the data pixel values over radial distance from the column density peak (see Fig. B.8). Solid gray lines show best fits to these data with Eqs. (3) and (8) and the parameters listed in Table 5. The parameters are also labeled on the diagram axes to illustrate their meaning, with the following characteristic radii: r1 = flat core profile radius (Eq. (3)), r1′ = radius to define consistent dense core boundary (Eqs. (10) and (11)), r2 = cloud radius at transition to halo (Eq. (6)), and rout = outer cloud boundary (Eq. (3)).
Current usage metrics show cumulative count of Article Views (full-text article views including HTML views, PDF and ePub downloads, according to the available data) and Abstracts Views on Vision4Press platform.
Data correspond to usage on the plateform after 2015. The current usage metrics is available 48-96 hours after online publication and is updated daily on week days.
Initial download of the metrics may take a while.