| Issue |
A&A
Volume 551, March 2013
|
|
|---|---|---|
| Article Number | L8 | |
| Number of page(s) | 4 | |
| Section | Letters | |
| DOI | https://doi.org/10.1051/0004-6361/201220364 | |
| Published online | 22 February 2013 | |
Chromospheric activity as age indicator
An L-shaped chromospheric-activity versus age diagram⋆
Centro de Astrofísica, Universidade do Porto,
Rua das Estrelas,
4150-762
Porto,
Portugal
e-mail:
This email address is being protected from spambots. You need JavaScript enabled to view it.
Received:
11
September
2012
Accepted:
24
January
2013
Abstract
Context. Chromospheric activity has been calibrated and widely used as an age indicator. However, it has been suggested that the viability of this age indicator is, in the best case, limited to stars younger than about 1.5 Gyr.
Aims. I aim to define the age range for which chromospheric activity is a robust astrophysical clock.
Methods. I collected literature measurements of the S-index in field stars, which is a measure of the strength of the H and K lines of the Ca II and a proxy for chromospheric activity, and exploited the homogeneous database of temperature and age determinations for field stars provided by the Geneva-Copenhagen survey of the solar neighbourhood.
Results. Field data, inclusive data previously used to calibrate chromospheric ages, confirm the result found using open cluster data, i.e. there is no decay of chromospheric activity after about 2 Gyr.
Conclusions. The only existing indication supporting the viability of chromospheric ages older than 2 Gyr is the similarity of chromospheric activity levels in the components of 35 dwarf binaries. However, even in the most optimistic scenario, uncertainty in age determination for field stars and lack of sufficient data in open clusters make any attempt of calibrating an age activity relationship for old stars premature. The hypothesis that chromospheric activity follows the Skumanich law, i.e. that it is proportional to t− 1/2, should be relaxed.
Key words: stars: activity
The data are only available at the CDS via anonymous ftp to cdsarc.u-strasbg.fr(130.79.128.5) or via http://cdsarc.u-strasbg.fr/viz-bin/qcat?J/A+A/551/L8
© ESO, 2013
1. Introduction
Chromospheric activity (CA) is the amount of energy emitted in the chromosphere, i.e. the
layer of a late-type star above the temperature gradient inversion. This energy is radiated
especially through emissions of strong resonance lines, whose flux is therefore a proxy for
CA. The S index is a measure of the strength of the chromospheric emission core of the H and
K lines of the Ca II,  is its conversion
into flux, and
is its conversion
into flux, and  is the flux
normalized to the bolometric emission of the star. These are the most commonly used proxies
for CA, and they have been monitored for decades in nearby stars in the Mount Wilson (see
e.g. Baliunas et al. 1995) and, more recently, in
several other observational campaigns (see e.g. Hall et al.
2007).
is the flux
normalized to the bolometric emission of the star. These are the most commonly used proxies
for CA, and they have been monitored for decades in nearby stars in the Mount Wilson (see
e.g. Baliunas et al. 1995) and, more recently, in
several other observational campaigns (see e.g. Hall et al.
2007).
The CA declines during the stellar life time, as does the rotation, which powers it. Therefore CA is in principle a good astrophysical clock and, as such, has been calibrated and widely used. However, CA, on top of its long-term decay, undergoes short-term variations. The Sun, for instance, has an activity cycle of 11 years with secular variations that caused the Maunder minimum. This sets limits on the precision of chromospheric ages based on one-epoch CA measurements.
Observations in open clusters suggested that CA in stars in open clusters at about 1.5 Gyr, such as IC 4651 and NGC 3680, already dropped to solar levels (Pace & Pasquini 2004; Lyra & Porto de Mello 2005). This result was confirmed by Zhao et al. (2011), who studied wide binaries. Pace et al. (2009) claimed that even in the age range between 0.7 and 1.2 Gyr any CA evolution must be less important than short-term variations, and that a sudden drop of CA occurred on a very short time-scale: 0.2 Gyr. These conclusions relied on the age determinations of Salaris et al. (2004). In fact, according to these, the ages of the active clusters, which all spanned roughly the same interval of CA levels, ranged from 0.7 Gyr (Hyades and Praesepe) to 1.2 Gyr (NGC 5822), while the ages of NGC 3680 and IC 4651, which are as inactive as the Sun, were estimated to be 1.4 and 1.7 Gyr, respectively. A more recent set of homogeneous age determinations for these clusters makes NGC 5822 0.9 Gyr (Carraro et al. 2011), IC 4651 1.5 Gyr, and NGC 3680 1.75 Gyr old (Anthony-Twarog et al. 2009). Therefore, according to the CA measurements of Pace et al. and these new age determinations, the transition from chromospherically active to inactive would occur in 0.6 Gyr, and, most important, the interval of time during which CA remains virtually constant is reduced to 0.2 Gyr. In other words, it is still warranted to investigate the viability of CA as an age indicator until 1.5 Gyr.
In contrast to the result of Pace & Pasquini (2004), Lyra & Porto de Mello (2005), and Zhao et al. (2011), several calibrations of CA as an age indicator have been published (see e.g. Soderblom et al. 1991; Donahue 1993; Lachaume et al. 1999; Mamajek & Hillenbrand 2008) based on field stars, binary systems, or open-cluster members, and these calibrations are claimed to be valid at all ages.
The problem that all of these studies face is the paucity of good data for open clusters older than about 1 Gyr, M 67 being the only such cluster with a rich sample of high-quality CA measurements made for stars spanning a wide range of temperatures (Giampapa et al. 2006). The sample of Pace & Pasquini (2004) and Pace et al. (2009) include, in addition to M 67 members, only seven stars older than 1 Gyr, two dwarfs in NGC 3680 and five in IC 4651, and they are all hotter than the Sun.
Mamajek & Hillenbrand (2008) reported only two more open clusters older than 1 Gyr with CA measurements: NGC 752 (15 stars observed) and NGC 188 (3 stars observed) originally observed by Barry et al. (1987) and Barry et al. (1984). However, these data were considered suspicious (Soderblom et al. 1991) and Mamajek & Hillenbrand (2008) did not use them either in their Table 5 or in their Fig. 4, where other cluster data are reported.
Clearly, more open-cluster data are needed. However, since the publication of the most recent CA calibration I have knowledge of, more S-index measurements were published, and new, precise, homogeneous determinations of stellar ages and temperatures for the solar neighbourhood have been made available. This allows us to reexamine CA evolution through the study of field stars.
2. The data
2.1. Field data
All the available data in the literature reporting S-index measurements for field dwarf
stars in the same scale as Mount-Wilson data were collected. The data include the
following sources: Arriagada (2011), Jenkins et al. (2011), Baliunas et al. (1995), Knutson et al.
(2010), López-Santiago et al. (2010),
Gray et al. (2003), Schröder et al. (2009), Cincunegui et
al. (2007), Lockwood et al. (2007), Duncan et al. (1991), Gray et al. (2006), Tinney et al. (2002),
Hall et al. (2007), White et al. (2007), Henry et al.
(1996), and Wright et al. (2004). Strassmeier et al. (2000) measured absolute H and K
emission-line fluxes of more than 1000 late-type stars, but they did not report S-index
measurements. I transformed their flux measurements into line strength
(HKstrass) by reverting their Eqs. (2) and (3), and then to an equivalent of
the S-index in the Mount Wilson scale, by calibrating a relationship between
HKstrass and the S-index for the 329 stars in their sample in common with at
least one of the other works mentioned above. The spread around a linear relationship
between HKstrass and S-index is roughly 10%, compatible with CA cycles and
errors. I also included data from Buccino & Mauas
(2008), which are measurements of the strength of the Mg II h and k lines,
transformed into the S index through a calibration made with a set of 117 nearly
simultaneous observations of Mg II and Ca II fluxes of 21 main-sequence stars. Data from
Lockwood et al. and Baliunas et al. are taken from the Mount Wilson survey and cover the
entire activity cycle for each target. I adopted them whenever possible. For the other
stars, when more than one measurement was available in the literature, the adopted S-index
was taken as the average between the highest and the lowest individual measurement
recorded, which best represents the time-averaged CA level, because typically stars are
not observed during an entire CA cycle. Unfortunately, some authors did not report single
measurements but only indicated the average S-index. Hall
et al. (2007) reported S-index measurements only for part of their total sample,
for the rest of the stars only values are
given, and the photometric information they used to transform S-index into
is not
indicated either. This problem affects 27 stars of their sample that could have been used
otherwise. Only one of these, HD 70110, was not measured in any of the other
aforementioned works.
Although S-index measurements come from a variety of different sources, they were all calibrated to match the same scale, which is the Mount Wilson scale. The most significant source of error is the intrinsic variability of CA. The conclusions presented here are independent of the choice of the sources, i.e. they hold if we discard one or more of the studies from the compilation, provided that sufficient data are analysed.
To guarantee homogeneity of temperature and age evaluations, this information was taken from the Geneva-Copenhagen survey of the Solar neighbourhood (GCS): a set of determinations of metallicity, rotation, age, kinematics, and Galactic orbits for a complete, magnitude-limited, and kinematically unbiased sample of 16 682 nearby F and G dwarf stars (Nordström et al. 2004). Two revised versions of the GCS were published by the same group based on improved uvby calibration (Holmberg et al. 2007) and on revision of the Hipparcos parallaxes (Holmberg et al. 2009). I used the last revision by Casagrande et al. (2011), which adopts the infrared flux method (IRFM) to improve the accuracy of temperature estimations. For this method, with the most up-to-date calibration, the uncertainty in the determinations of the Teff is of the order of 30 K, plus a systematic error, i.e. uncertainty in the zero point, of 15 K (Casagrande et al. 2006, 2010). Accurate information on binarity is also given in this last version of the GCS, and I used it to select single stars.
By cross-correlating the collection of S-index measurements with the GCS data set and
discarding multiple systems, I finally selected 1744 single dwarves. The data collected
about these stars are available at the CDS in electronic form. From these, the 494 stars
with age estimations precise enough for the scope of the present work were additionally
selected (σage < 2 Gyr or
 ).
).
S-indices were transformed into following
the procedure of Noyes et al. (1984), which
involves B − V colours. The adopted values for
B − V where obtained from the temperatures by
reverting the calibration of Casagrande et al.
(2010).
2.2. Open cluster data
I used here log evaluations
and B − V colours from the compilation of Mamajek & Hillenbrand (2008) for the Ursa Major
moving group (Collinder 285), Hyades, and M 67, while I ignored data on younger clusters
of the same source, since they are not relevant for the scope of the present work. I added
data of NGC 752 and NGC 188 from Barry et al.
(1987), and from Pace et al. (2009) the data
of Praesepe, IC 4756, NGC 5822, IC 4651, NGC 3680, as well as one Hyades member and four
M 67 members not included in the sample of Mamajek
& Hillenbrand. Pace et al. used
spectroscopic temperatures for their stars, and I adopted them here. The other
temperatures were obtained through the calibration of Casagrande et al. (2010) from B − V dereddened
colours given in the respective source.
The S-index measurements of Barry et al. were made
on spectra at a lower resolution (~2 Å FWHM) than the classical
Mount-Wilson data, but they were converted to match the Mount-Wilson system. However, when
I transformed them into using Noyes et al. (1984), I obtained results completely
inconsistent with the values published in Barry et
al., with typical differences of 0.1 in logarithmic scale, and even larger when
taking into account the correction suggested by Soderblom
et al. (1991). I believe that Barry et al.’s S-index measurements are
trustworthy, since their conversion into gives
reasonable results, while both Barry et al.’s values of
 and their correction
following Soderblom et al. (1991) are suspicious.
As for the former estimations, in addition to being inconsistent with the S-indices from
which they are supposed to be derived, the highest
log value for
NGC 752 exceeds that for the most active star among Hyades and Collinder 285 by 0.38 dex.
This is highly implausible since Hyades and Collinder 285 are younger than NGC 752 and
their sample considered here outnumbers by more than 3 to 1 that of NGC 752. By
introducing the correction of Soderblom et al.,
this probably spurious value is decreased by only 0.01 dex in the logarithmic scale, and
one obtains log
and their correction
following Soderblom et al. (1991) are suspicious.
As for the former estimations, in addition to being inconsistent with the S-indices from
which they are supposed to be derived, the highest
log value for
NGC 752 exceeds that for the most active star among Hyades and Collinder 285 by 0.38 dex.
This is highly implausible since Hyades and Collinder 285 are younger than NGC 752 and
their sample considered here outnumbers by more than 3 to 1 that of NGC 752. By
introducing the correction of Soderblom et al.,
this probably spurious value is decreased by only 0.01 dex in the logarithmic scale, and
one obtains log  dex for the least active
of the three stars of NGC 188. This is not quite as suspicious as the case for the most
active star in NGC 752, but still calls for some mistrust. In fact, it is 0.28 dex lower
than the log value of
the least active of the 26 stars in M 67. In addition, among the 1744 single stars with CA
measurements collected here, only 12 stars have
log
dex for the least active
of the three stars of NGC 188. This is not quite as suspicious as the case for the most
active star in NGC 752, but still calls for some mistrust. In fact, it is 0.28 dex lower
than the log value of
the least active of the 26 stars in M 67. In addition, among the 1744 single stars with CA
measurements collected here, only 12 stars have
log  dex, while the most active
NGC 188 member, with Soderblom et al.’s correction,
would have a CA above the average of field stars. I therefore used
values
derived from published S-indices for NGC 752 and NGC 188. Because I failed to identify the
star numbering system used by Barry et al., and they
did not report the stellar coordinates, I could only use the
B − V colours given in the paper without updating the
photometry and membership information. The CA measurements in NGC 752 and NGC 188 should
be taken with a grain of salt. The S-index measurements from Pace et al. (2009) are based on high-signal-to-noise and
high-resolution spectra taken with UVES at the VLT, but they are performed in a different
way, using only the K-line. I used the 17 stars, either M 67 or Hyades members and the
Sun, in common between Pace et al. (2009) and the
compilation of open clusters by Mamajek &
Hillenbrand (2008) to find a linear relationship between the S-index measured by
Pace et al. and the Mount-Wilson one, and to
transform the former into the Mount-Wilson scale. The 17 stars in common span large part
of the entire CA range of the open cluster sample, and their deviation from the the linear
regression is of only ~5%, therefore the transformation is dependable.
dex, while the most active
NGC 188 member, with Soderblom et al.’s correction,
would have a CA above the average of field stars. I therefore used
values
derived from published S-indices for NGC 752 and NGC 188. Because I failed to identify the
star numbering system used by Barry et al., and they
did not report the stellar coordinates, I could only use the
B − V colours given in the paper without updating the
photometry and membership information. The CA measurements in NGC 752 and NGC 188 should
be taken with a grain of salt. The S-index measurements from Pace et al. (2009) are based on high-signal-to-noise and
high-resolution spectra taken with UVES at the VLT, but they are performed in a different
way, using only the K-line. I used the 17 stars, either M 67 or Hyades members and the
Sun, in common between Pace et al. (2009) and the
compilation of open clusters by Mamajek &
Hillenbrand (2008) to find a linear relationship between the S-index measured by
Pace et al. and the Mount-Wilson one, and to
transform the former into the Mount-Wilson scale. The 17 stars in common span large part
of the entire CA range of the open cluster sample, and their deviation from the the linear
regression is of only ~5%, therefore the transformation is dependable.
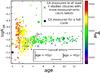 |
Fig. 1 log |
3. Results and discussion
3.1. Field stars
In Fig. 1 the sample of 494 stars is plotted in a
log versus age
diagram. Typical errors in CA reported in the figure are estimated by looking at the full
CA variations for the stars measured twice or more. For about 95% of those stars, full
variations are within 0.4 dex, and within 0.2 dex for stars older than 4 Gyr, therefore I
adopted 0.2 dex as typical error for stars younger than 4 Gyr and 0.1 dex for the others.
1σ errors in age were imposed, as a selection criterion, to be either
less than 2 Gyr or less than 30% of the age. As a result, the typical horizontal error bar
is of about 1.5 Gyr. The L-shaped distribution of the bulk of the data points in Fig.
1 strongly suggests that the decay of CA stops
completely at a relative early age. This age may appear to be about 3 Gyr in Fig. 1 as a result of the errors that scatter the data points
horizontally, but could be much younger in reality. It is not possible to understand how
CA evolves in this first phase, because the uncertainty in the age is of the same order of
magnitude as the time span over which the decay occurs. No matter how data are further
selected on the basis of the number of CA measurements available and on the temperature,
there is no indication of a CA-age anticorrelation for older stars. The vertical spread of
the points relative to old stars is compatible with being caused by cyclic variations,
which proves that CA measurements are reliable also for inactive stars. The presence of
very inactive stars only at young ages is connected with the temperature. Indeed, among
the 1744 single stars with CA measurements collected here, the 11 least active are all
hotter than 6300 K, and are therefore young.
Following Rocha-Pinto & Maciel (1998), I
checked the correlation between metallicity and
log : the
Pearson correlation coefficient between them is roughly − 0.2.
3.2. Open clusters
Figure 2 shows a
log versus
temperature diagram. The ages reported in the legend are taken from the following sources
(in order of adopted priority): Carraro et al.
(2011), Anthony-Twarog et al. (2009), Salaris et al. (2004), King et al. (2003).
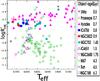 |
Fig. 2 log |
Data points in Fig. 2 can be broadly divided into
two groups, one with the bulk of the young-cluster members (age ≤1.45 Gyr, filled
symbols), with a slightly increasing trend of log with
decreasing temperature, and one with the bulk of old cluster members (age ≥1.5 Gyr, empty
symbols), characterized by a more complicated pattern of
log as a
function of temperature. Only three of the 78 members of the former group are less active
than log  dex, and only three out of
the 89 members of the latter group, all M 67 members, are more active than
log
dex, and only three out of
the 89 members of the latter group, all M 67 members, are more active than
log  dex. The reason why three
M 67 stars are at a Hyades activity level is probably binarity, as confirmed by the fact
that one of these stars is Sanders 747, whose spectrum taken with UVES at the VLT
(observing run 66.D-0457) clearly shows that it is a double-lined binary. It follows that
no more than ~5% of the single stars should be expected to have an activity atypical for
their age. Although the CA levels spanned by the two groups almost overlap, the average
difference between them is as large as Δlog
dex. The reason why three
M 67 stars are at a Hyades activity level is probably binarity, as confirmed by the fact
that one of these stars is Sanders 747, whose spectrum taken with UVES at the VLT
(observing run 66.D-0457) clearly shows that it is a double-lined binary. It follows that
no more than ~5% of the single stars should be expected to have an activity atypical for
their age. Although the CA levels spanned by the two groups almost overlap, the average
difference between them is as large as Δlog  dex,
i.e. twice the typical error for young stars and four times as much that for old stars.
dex,
i.e. twice the typical error for young stars and four times as much that for old stars.
According to the most recent age determinations, the only cluster of the active group
significantly older than the Hyades studied so far is NGC 752, which is on average
slightly less active than Hyades and Collinder 285, even though all NGC 752 members, with
the exception of one outlier, have CA levels within the range encompassed by the bulk of
Hyades stars. The drop of the average value of log between the
age of NGC 752 and that of the youngest inactive cluster is ~0.3 dex or more. The youngest
inactive cluster, according to Anthony-Twarog et al.
(2009), is IC 4651, only 50 Myr older than NGC 752. Therefore, even after the
revision of open-cluster ages by Carraro et al. and
Anthony-Twarog et al., we still have an indication
of a very rapid CA drop. However, the dependability of the data on NGC 752 is questionable
(see Sect. 2.2).
The dependability of the NGC 188 data is also questionable, and we have only three stars in a narrow temperature range. It is interesting, however, that it is the oldest cluster, by far more active than IC 4651, NGC 3680, and M 67, thus definitely pointing to the absence of CA decay after 1.5 Gyr.
3.3. Accuracy of the measurements
Data shown in Figs. 1 and 2 are both characterized by the lack of old and active stars, as
expected. The presence in Fig. 1 of young and
inactive stars can be explained by the errors in age. In Fig. 1, the age limit after which no more active stars are present is 3 Gyr,
while in Fig. 2 this age limit is 1.5 Gyr. Again,
this is compatible with the 1σ errors in the age quoted by Casagrande et al. (2011), which, for the upper-left
bunch of data points of the diagram in Fig. 1, peak
around 0.2 Gyr but extend all over to the imposed upper limit of 2 Gyr. There is a
significant difference in the CA limit that sets the distinction between active and
inactive stars: for open clusters this limit is at
log  , while looking at the field
data, the same limit should be the solar CA level. This last circumstance seems to be
incompatible with the Sun being in the middle of the CA distribution of M 67 members. This
raises the question whether the OC data are on a scale different than the field data, but
this would be surprising, since both Pace et al.
(2009) and Giampapa et al. (2006) found
that most of M 67 members have CA levels that fall in the range spanned by the Sun, they
both used high-resolution and good signal-to-noise spectra of the Ca II H (only Giampapa
et al.) and K lines, and they have temperature estimations that perfectly match for three
solar-type stars, but differ systematically by about 100 K for the other (hotter) stars.
, while looking at the field
data, the same limit should be the solar CA level. This last circumstance seems to be
incompatible with the Sun being in the middle of the CA distribution of M 67 members. This
raises the question whether the OC data are on a scale different than the field data, but
this would be surprising, since both Pace et al.
(2009) and Giampapa et al. (2006) found
that most of M 67 members have CA levels that fall in the range spanned by the Sun, they
both used high-resolution and good signal-to-noise spectra of the Ca II H (only Giampapa
et al.) and K lines, and they have temperature estimations that perfectly match for three
solar-type stars, but differ systematically by about 100 K for the other (hotter) stars.
4. Summary and conclusions
I collected a very large sample of published S-index measurements that were calibrated to match the Mount-Wilson scale. For field stars, I used information on temperatures and ages of the very exhaustive and homogeneous determinations of the GCS, adopting the last revision by Casagrande et al. (2011).
Not only open-cluster data, but also field-star data strongly favour the conclusion of Pace & Pasquini (2004), Lyra & Porto de Mello (2005), and Zhao et al. (2011): there is no evolution of chromospheric activity after ~1.5 Gyr.
Mamajek & Hillenbrand (2008) collected data
on 35 dwarf binaries. The CA levels of their components are strongly correlated, even if we
consider only the systems more inactive than log . This is the only piece of
evidence supporting a correlation between CA and age holding for old stars. The search for
an alternative explanation for this fact, invoking processes typical of binary systems, is
definitely warranted, but the possibility that the CA is a tight, strictly monotonic
function of time, even though extremely unlikely in the light of the analysis presented
here, cannot be completely ruled out. According to the present analysis, this function, if
it exists, is not like ∝t− 1/2, as
tentatively suggested by Skumanich (1972) on the
basis of very scanty data and widely used ever since their publication, and our present
knowledge of it is too poor for it to be an astrophysical clock of any use.
At present, the only prediction on age we can infer from CA is whether a star is younger or older than the open cluster NGC 752, which is estimated to be 1.45 Gyr old, with the caveat that there exist young and very inactive stars hotter than 6300 K. The situation is likely to improve rapidly due to the accumulation of asteroseismic data. Indeed, asteroseismology has proved to allow age determination with a good precision (Christensen-Dalsgaard et al. 2010; Mathur et al. 2012; Metcalfe et al. 2012).
Acknowledgments
It is a pleasure to acknowledge Simone Recchi and José-Dias do Nascimento Jr. for useful discussions. The referee’s suggestions considerably improved the quality of this manuscript. The author is supported by grant SFRH/BPD/39254/2007 and acknoweldges financial support by the project PTDC/CTE-AST/098528/2008, both from FCT, Portugal.
References
- Anthony-Twarog, B. J., Deliyannis, C. P., Twarog, B. A., Croxall, K. V., & Cummings, J. D. 2009, AJ, 138, 1171 [NASA ADS] [CrossRef] [Google Scholar]
- Arriagada, P. 2011, ApJ, 734, 70 [NASA ADS] [CrossRef] [Google Scholar]
- Baliunas, S. L., Donahue, R. A., Soon, W. H., et al. 1995, ApJ, 438, 269 [NASA ADS] [CrossRef] [Google Scholar]
- Barry, D. C., Hege, K., & Cromwell, R. H. 1984, ApJ, 277, L65 [NASA ADS] [CrossRef] [Google Scholar]
- Barry, D. C., Cromwell, R. H., & Hege, E. K. 1987, ApJ, 315, 264 [NASA ADS] [CrossRef] [Google Scholar]
- Buccino, A. P., & Mauas, P. J. D. 2008, A&A, 483, 903 [NASA ADS] [CrossRef] [EDP Sciences] [Google Scholar]
- Carraro, G., Anthony-Twarog, B. J., Costa, E., Jones, B. J., & Twarog, B. A. 2011, AJ, 142, 127 [NASA ADS] [CrossRef] [Google Scholar]
- Casagrande, L., Portinari, L., & Flynn, C. 2006, MNRAS, 373, 13 [NASA ADS] [CrossRef] [Google Scholar]
- Casagrande, L., Ramírez, I., Meléndez, J., Bessell, M., & Asplund, M. 2010, A&A, 512, A54 [NASA ADS] [CrossRef] [EDP Sciences] [Google Scholar]
- Casagrande, L., Schönrich, R., Asplund, M., et al. 2011, A&A, 530, A138 [NASA ADS] [CrossRef] [EDP Sciences] [Google Scholar]
- Christensen-Dalsgaard, J., Kjeldsen, H., Brown, T. M., et al. 2010, ApJ, 713, L164 [NASA ADS] [CrossRef] [Google Scholar]
- Cincunegui, C., Díaz, R. F., & Mauas, P. J. D. 2007, A&A, 469, 309 [NASA ADS] [CrossRef] [EDP Sciences] [Google Scholar]
- Donahue, R. A. 1993, Ph.D. Thesis, New Mexico State University [Google Scholar]
- Duncan, D. K., Vaughan, A. H., Wilson, O. C., et al. 1991, ApJS, 76, 383 [NASA ADS] [CrossRef] [Google Scholar]
- Giampapa, M. S., Hall, J. C., Radick, R. R., & Baliunas, S. L. 2006, ApJ, 651, 444 [Google Scholar]
- Gray, R. O., Corbally, C. J., Garrison, R. F., McFadden, M. T., & Robinson, P. E. 2003, AJ, 126, 2048 [NASA ADS] [CrossRef] [Google Scholar]
- Gray, R. O., Corbally, C. J., Garrison, R. F., et al. 2006, AJ, 132, 161 [NASA ADS] [CrossRef] [Google Scholar]
- Hall, J. C., Lockwood, G. W., & Skiff, B. A. 2007, AJ, 133, 862 [NASA ADS] [CrossRef] [Google Scholar]
- Henry, T. J., Soderblom, D. R., Donahue, R. A., & Baliunas, S. L. 1996, AJ, 111, 439 [NASA ADS] [CrossRef] [Google Scholar]
- Holmberg, J., Nordström, B., & Andersen, J. 2007, A&A, 475, 519 [NASA ADS] [CrossRef] [EDP Sciences] [MathSciNet] [Google Scholar]
- Holmberg, J., Nordström, B., & Andersen, J. 2009, A&A, 501, 941 [NASA ADS] [CrossRef] [EDP Sciences] [Google Scholar]
- Jenkins, J. S., Murgas, F., Rojo, P., et al. 2011, A&A, 531, A8 [NASA ADS] [CrossRef] [EDP Sciences] [Google Scholar]
- King, J. R., Villarreal, A. R., Soderblom, D. R., Gulliver, A. F., & Adelman, S. J. 2003, AJ, 125, 1980 [NASA ADS] [CrossRef] [Google Scholar]
- Knutson, H. A., Howard, A. W., & Isaacson, H. 2010, ApJ, 720, 1569 [NASA ADS] [CrossRef] [Google Scholar]
- Lachaume, R., Dominik, C., Lanz, T., & Habing, H. J. 1999, A&A, 348, 897 [NASA ADS] [Google Scholar]
- Lockwood, G. W., Skiff, B. A., Henry, G. W., et al. 2007, ApJS, 171, 260 [NASA ADS] [CrossRef] [Google Scholar]
- López-Santiago, J., Montes, D., Gálvez-Ortiz, M. C., et al. 2010, A&A, 514, A97 [NASA ADS] [CrossRef] [EDP Sciences] [Google Scholar]
- Lyra, W., & Porto de Mello, G. F. 2005, A&A, 431, 329 [NASA ADS] [CrossRef] [EDP Sciences] [Google Scholar]
- Mamajek, E. E., & Hillenbrand, L. A. 2008, ApJ, 687, 1264 [NASA ADS] [CrossRef] [Google Scholar]
- Mathur, S., Metcalfe, T. S., Woitaszek, M., et al. 2012, ApJ, 749, 152 [NASA ADS] [CrossRef] [Google Scholar]
- Metcalfe, T. S., Chaplin, W. J., Appourchaux, T., et al. 2012, ApJ, 748, L10 [NASA ADS] [CrossRef] [Google Scholar]
- Nordström, B., Mayor, M., Andersen, J., et al. 2004, A&A, 418, 989 [NASA ADS] [CrossRef] [EDP Sciences] [Google Scholar]
- Noyes, R. W., Hartmann, L. W., Baliunas, S. L., Duncan, D. K., & Vaughan, A. H. 1984, ApJ, 279, 763 [NASA ADS] [CrossRef] [Google Scholar]
- Pace, G., & Pasquini, L. 2004, A&A, 426, 1021 [NASA ADS] [CrossRef] [EDP Sciences] [Google Scholar]
- Pace, G., Melendez, J., Pasquini, L., et al. 2009, A&A, 499, L9 [NASA ADS] [CrossRef] [EDP Sciences] [Google Scholar]
- Rocha-Pinto, H. J., & Maciel, W. J. 1998, MNRAS, 298, 332 [NASA ADS] [CrossRef] [Google Scholar]
- Salaris, M., Weiss, A., & Percival, S. M. 2004, A&A, 414, 163 [NASA ADS] [CrossRef] [EDP Sciences] [Google Scholar]
- Schröder, C., Reiners, A., & Schmitt, J. H. M. M. 2009, A&A, 493, 1099 [NASA ADS] [CrossRef] [EDP Sciences] [Google Scholar]
- Skumanich, A. 1972, ApJ, 171, 565 [NASA ADS] [CrossRef] [Google Scholar]
- Soderblom, D. R., Duncan, D. K., & Johnson, D. R. H. 1991, ApJ, 375, 722 [NASA ADS] [CrossRef] [Google Scholar]
- Strassmeier, K., Washuettl, A., Granzer, T., Scheck, M., & Weber, M. 2000, A&AS, 142, 275 [NASA ADS] [CrossRef] [EDP Sciences] [Google Scholar]
- Tinney, C. G., McCarthy, C., Jones, H. R. A., et al. 2002, MNRAS, 332, 759 [NASA ADS] [CrossRef] [Google Scholar]
- White, R. J., Gabor, J. M., & Hillenbrand, L. A. 2007, AJ, 133, 2524 [NASA ADS] [CrossRef] [Google Scholar]
- Wright, J. T., Marcy, G. W., Butler, R. P., & Vogt, S. S. 2004, ApJS, 152, 261 [NASA ADS] [CrossRef] [Google Scholar]
- Zhao, J. K., Oswalt, T. D., Rudkin, M., Zhao, G., & Chen, Y. Q. 2011, AJ, 141, 107 [NASA ADS] [CrossRef] [Google Scholar]
All Figures
|
Fig. 1 log |
| In the text | |
|
Fig. 2 log |
| In the text | |
Current usage metrics show cumulative count of Article Views (full-text article views including HTML views, PDF and ePub downloads, according to the available data) and Abstracts Views on Vision4Press platform.
Data correspond to usage on the plateform after 2015. The current usage metrics is available 48-96 hours after online publication and is updated daily on week days.
Initial download of the metrics may take a while.