Free Access
Fig. B.1
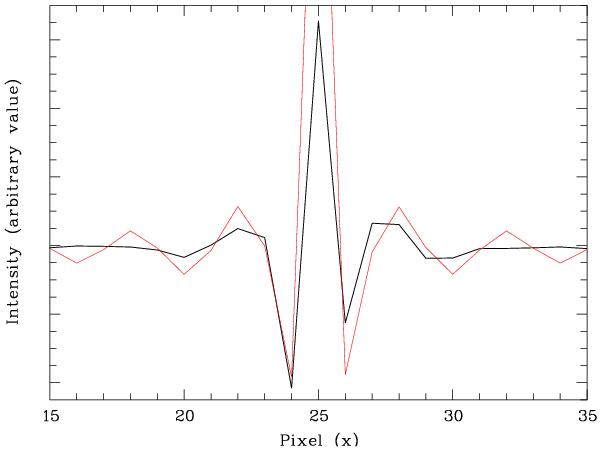
Black curve: numerical artefacts along the image x-axis coming from the brightest star in the CL J1449+0856 field of view (α = 14:49:14.820; δ = + 08:56:12.70) after removing the object image from the sky image (see Sect. 3). Red curve: SinC modelization.
Current usage metrics show cumulative count of Article Views (full-text article views including HTML views, PDF and ePub downloads, according to the available data) and Abstracts Views on Vision4Press platform.
Data correspond to usage on the plateform after 2015. The current usage metrics is available 48-96 hours after online publication and is updated daily on week days.
Initial download of the metrics may take a while.