Free Access
Fig. 4
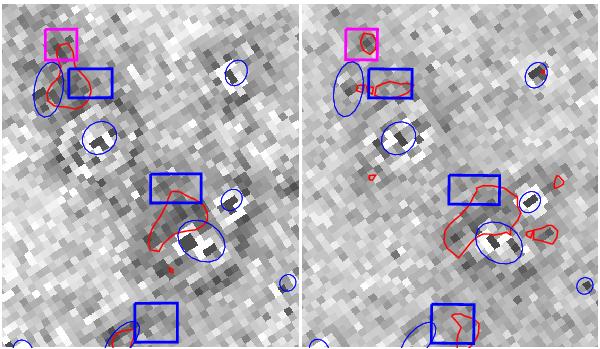
Residual images computed on the individual exposures (left: 7680 s, right: 10 240 s). The red contours show the 2σ detection level. The blue ellipses are the SExtractor-detected objects. The blue rectangles show the locations of the diffuse light sources detected in the summed image (see Fig. 1).
Current usage metrics show cumulative count of Article Views (full-text article views including HTML views, PDF and ePub downloads, according to the available data) and Abstracts Views on Vision4Press platform.
Data correspond to usage on the plateform after 2015. The current usage metrics is available 48-96 hours after online publication and is updated daily on week days.
Initial download of the metrics may take a while.