Fig. 3
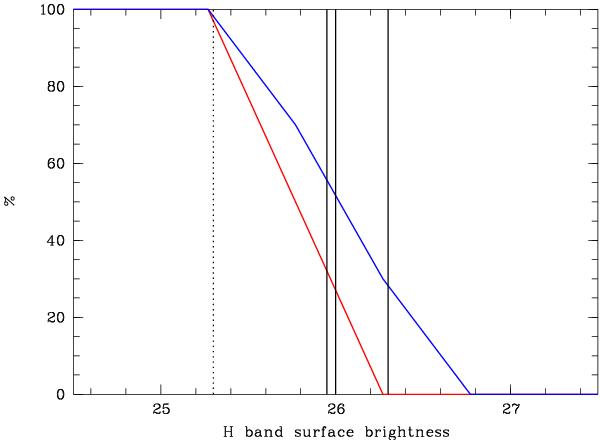
Percentage of recovered diffuse light sources as defined in the text versus H-band surface brightness. Blue line: percentage in the cluster region. Red line: percentage in the high noise region (see Fig. 2). The three vertical solid lines show the surface brightness of the three real diffuse light sources. The vertical dotted line is the surface brightness of Obj1 as shown in Fig. 1.
Current usage metrics show cumulative count of Article Views (full-text article views including HTML views, PDF and ePub downloads, according to the available data) and Abstracts Views on Vision4Press platform.
Data correspond to usage on the plateform after 2015. The current usage metrics is available 48-96 hours after online publication and is updated daily on week days.
Initial download of the metrics may take a while.