Free Access
Fig. 2
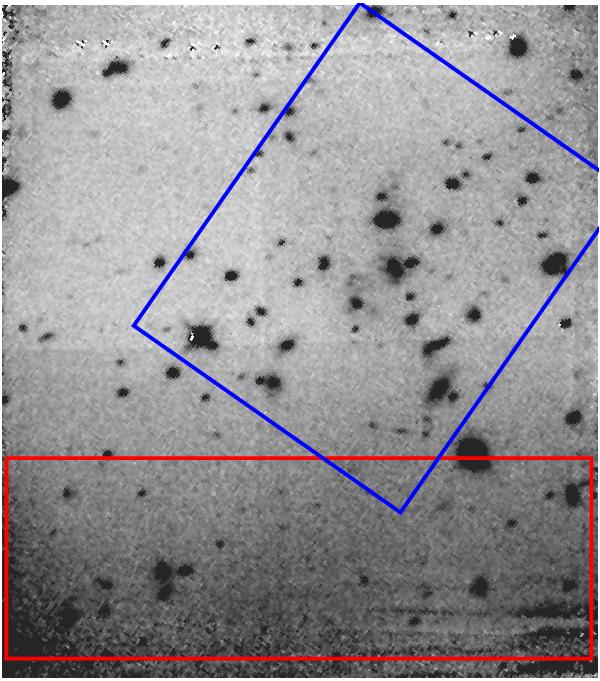
H-band NICMOS image of CL J1449+0856. The blue rectangle is the region centred on the cluster itself, and the red rectangle is the region with the strongest flat-field residuals.
Current usage metrics show cumulative count of Article Views (full-text article views including HTML views, PDF and ePub downloads, according to the available data) and Abstracts Views on Vision4Press platform.
Data correspond to usage on the plateform after 2015. The current usage metrics is available 48-96 hours after online publication and is updated daily on week days.
Initial download of the metrics may take a while.